


Why does service waste undermine growth in CX and operations?
Leaders face rising demand, rising complexity, and rising cost. Service organisations carry hidden waste in the form of delays, rework, handoffs, and avoidable customer contacts. Lean defines waste as any activity that consumes resources but does not add value as defined by the customer. When waste accumulates, cycle times lengthen, operating expenses climb, and customer satisfaction declines. Lean gives executives a practical system to expose and remove this waste while protecting quality and speed.¹
What is Lean in services, in plain terms?
Lean is a management system that improves flow and quality by eliminating waste and focusing on value from the customer’s perspective. The roots of Lean trace to the Toyota Production System, which codified principles such as just-in-time, built-in quality, and continuous improvement. These principles apply to services when we translate physical inventory into queues of work, rework loops, tickets, and customer contacts. Lean in services prioritises reliable flow, low variation, and fast learning over local utilisation of people or systems.²
Where does “waste” show up in contact centres and service teams?
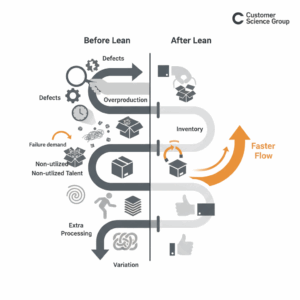
Service waste appears in eight familiar forms: defects, overproduction, waiting, non-utilised talent, transportation, inventory, motion, and extra processing. In a contact centre, defects show as repeat calls from unresolved issues. Waiting shows as customers in queues and work sitting in backlogs. Extra processing shows as duplicate data entry and manual reconciliation. This mapping helps teams see invisible losses in time and attention. The diagnostic lens is the same as manufacturing, but the artefacts are digital or conversational.³
What is “failure demand,” and why should executives care?
Failure demand is customer demand created by a service failing to do something or to do it right the first time. In practical terms, it is avoidable contact such as “I am calling because my order never arrived” or “I am following up because the last agent did not fix it.” Failure demand often consumes a large share of contact volume in public and private services. Reducing it protects capacity, improves experience, and lowers cost without deflecting legitimate demand.⁴
How does variation create queues, cost, and customer pain?
Variation is any inconsistency in arrivals, handling times, routing, or quality. Queueing theory shows that as utilisation rises, even modest variability drives exponential growth in waiting time. Kingman’s formula summarises the relationship: delays are a product of utilisation, variability, and service time. This is why overloaded teams with unpredictable work suffer long queues and escalating backlogs. Reducing variation or adding flexible capacity shortens waits and stabilises outcomes.⁵
How do Lean flow principles translate to service environments?
Lean flow focuses on moving the customer’s request from start to finish with minimal interruption. In services, “inventory” is work-in-process such as cases, referrals, and tasks. “Flow” means a request passes through the system with few handoffs and no rework. Practical mechanisms include triage at the first point of contact, right-sized work batching, visible queues, and capability to complete work at the first point of resolution. Executives who design for flow improve both speed and quality while lowering operating expense.⁶
How do resource efficiency and flow efficiency differ in services?
Resource efficiency measures how busy people or systems appear. Flow efficiency measures how fast a customer request completes. Services often optimise resource efficiency by maximising agent occupancy or specialist utilisation. This produces hidden queues and more handoffs. Flow efficiency rebalances the system to shorten end-to-end elapsed time, even if that means lower local utilisation. Organisations that shift to flow efficiency usually improve customer satisfaction and reduce cost to serve.⁷
How should leaders classify and measure service waste and variation?
Executives should build a coherent taxonomy and scorecard that makes waste and variation visible across channels and processes.
Define value and failure demand at each entry point. Tag contacts and cases accordingly. Trend the ratio weekly.⁴
Map end-to-end journeys with value stream mapping. Identify queues, rework loops, and handoffs. Quantify dwell time and first-time-right rates.¹
Track arrival variability, handling time variability, and utilisation by queue. Use the VUT (Kingman) equation to estimate waiting time sensitivity.⁵
Measure quality using a proven service quality construct such as SERVQUAL or its adapted dimensions. Connect quality gaps to rework and repeat contacts.⁸
Report flow efficiency alongside occupancy. Balance both measures when making capacity decisions.⁷
How do Lean methods reduce failure demand and cycle time?
Lean methods attack root causes of waste and variation through structured improvement and system design.
Standardise at the point of work. Clear, simple standards reduce variation in handling times and outcomes.²
Build quality in. Error-proof forms, guided workflows, and real-time validation prevent defects instead of catching them later.²
Empower first-contact resolution. Multi-skilling and knowledge design reduce handoffs and rework loops.³
Level the work. Workload balancing and small, frequent releases reduce arrival spikes and lower queue volatility.⁶
Make problems visible. Visual management, andon-style escalation, and daily performance huddles surface abnormalities quickly.²
Which operational trade-offs matter most in CX and service?
Every service system must buffer variability with capacity, inventory, or time. If capacity is constrained, the system pays in waiting time and backlogs. If the system adds capacity, cost increases unless failure demand falls. The best trade-off is to remove avoidable variation and waste at the source, so capacity turns into speed, not idle time. Leaders who see these physics stop chasing utilisation targets and start designing flow-centric systems.⁶
How do we design a practical roadmap to cut waste within 90 days?
Executives can steer a pragmatic 90-day Lean program that protects customers and employees while proving value.
Baseline demand and quality. Tag failure demand, measure first-contact resolution, and quantify top five drivers of repeat contacts.⁴
Map one critical journey. Select a high-volume request, map the end-to-end flow, and isolate queues and rework.¹
Stabilise the entry point. Standardise intake, strengthen knowledge, and route for completion at first contact.⁶
Remove one rework loop. Fix the defect at source through form redesign, data validation, or policy clarification.²
Shift the metric mix. Add flow efficiency and lead time targets to balance occupancy and AHT.⁷
Run weekly PDCA. Use small experiments, visible results, and leader standard work to lock in gains.²
What results should leaders expect and how do we prove them?
Leaders should expect three early signals. First, the ratio of failure demand to value demand drops as defects and breaks in the journey are removed. Second, end-to-end lead time declines because queues shrink and handoffs fall. Third, customer satisfaction improves as first-time-right rates rise. Over time, the cost to serve falls as workload is displaced by quality at source. These effects are supported by decades of Lean practice, queueing theory, and service quality research.²
How does this primer connect to Customer Experience and Service Transformation?
Customer Experience seeks reliable outcomes with minimal effort. Service Transformation seeks scalable operations that absorb complexity without passing it to customers. Lean aligns both aims by eliminating waste, controlling variation, and protecting flow. The method provides a common language for design, operations, and technology. Executives who adopt Lean in services create a system that serves customers faster, simplifies work for employees, and grows capacity without linear cost.¹
FAQ
What is failure demand in customer service and how do we measure it?
Failure demand is contact volume caused by a service failing to do something or to do it right. Measure it by tagging avoidable contacts at entry and trending the ratio of failure to value demand by reason code.⁴
Why does high agent utilisation increase queue times in contact centres?
Queueing theory shows waiting time rises sharply as utilisation approaches capacity, especially when arrival and handling times vary. Kingman’s formula explains this VUT relationship.⁵
Which Lean wastes are most common in digital service and back-office work?
The most common wastes are defects and rework, waiting in queues, extra processing such as duplicate data entry, and motion in the form of system hopping. Mapping the eight wastes to workflows reveals these losses.³
How do we balance flow efficiency and resource efficiency in operations?
Flow efficiency prioritises end-to-end speed for the customer request. Resource efficiency prioritises local utilisation. Shifting toward flow efficiency reduces handoffs and queues, usually improving both speed and cost to serve.⁷
Which first steps cut variation and demand quickly in a contact centre?
Start by standardising intake, improving knowledge for first-contact resolution, and fixing one high-volume defect at source. These actions reduce failure demand and stabilise handling time variation.²
What metrics prove Lean impact on Customer Experience?
Track failure demand ratio, first-contact resolution, end-to-end lead time, and flow efficiency alongside traditional occupancy and AHT. These metrics connect operational design to customer outcomes.⁴
Which Customer Science services align with this Lean roadmap?
This primer supports Customer Experience and Service Transformation, Service Innovation and Transformation, and Process Re-Engineering. These disciplines use Lean methods to eliminate waste and variation and to lift flow efficiency at scale.¹
Sources
Lean Thinking, 2nd Edition — James P. Womack, Daniel T. Jones, 2003, Lean Enterprise Institute. https://www.lean.org/store/book/lean-thinking-2nd-edition/
Toyota Production System: Beyond Large-Scale Production — Taiichi Ohno, 1988, Taylor & Francis. https://www.taylorfrancis.com/books/mono/10.4324/9780429273018/toyota-production-system-taiichi-ohno
8 Wastes of Lean Manufacturing in a Services Context — Process Excellence Network, 2009, PEX Network. https://www.processexcellencenetwork.com/lean-six-sigma-business-performance/columns/8-wastes-of-lean-manufacturing-in-a-services-conte
Failure Demand — Vanguard Consulting (John Seddon), 2024, Beyond Command and Control. https://beyondcommandandcontrol.com/failure-demand/
Kingman’s Formula (VUT equation) — 2024, Wikipedia. https://en.wikipedia.org/wiki/Kingman%27s_formula
Factory Physics: The Science of Lean — Wallace J. Hopp, Mark L. Spearman, 2018, Lean Enterprise Academy (slide deck excerpt). https://leanenterprise.org.uk/wp-content/uploads/2018/12/4.-Wally-Hopp-Factory-Physics-The-Science-of-Lean.pdf
This Is Lean: Resolving the Efficiency Paradox — Niklas Modig, Pär Åhlström, 2011, Official site. https://thisislean.com/
SERVQUAL: A Multiple-Item Scale for Measuring Consumer Perceptions of Service Quality — A. Parasuraman, Valarie A. Zeithaml, Leonard L. Berry, 1988, Journal of Retailing. https://pdf4pro.com/file/114d7f/wp_content_uploads_2018_09_Parasuraman_et_al_Journal_of_Retailing_1988_2.pdf.pdf