


Why do leaders need accessibility and equity baked into service design now?
Executives face a simple equation. Inclusive services win customers, reduce risk, and sharpen efficiency. The scale of need is not marginal. The World Health Organization estimates that 1.3 billion people, or one in six globally, live with significant disability.¹ Digital, physical, and service barriers block this market and create avoidable friction across every channel. When leaders treat accessibility as core to Customer Experience and Service Transformation, they convert exclusion into measurable advantage. The case is commercial, human, and regulatory. The UK’s “Purple Pound” alone represents an estimated £274 billion in annual spending power, which signals the size of opportunity that accessible service design can unlock.²
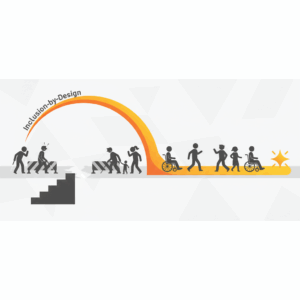
What is “inclusion-by-design” in practical terms?
Inclusion-by-design means building accessibility and equity into strategies, processes, and standards from discovery through operations. It treats accessibility as a nonfunctional requirement with functional impact. The model anchors to global standards such as the W3C Web Content Accessibility Guidelines, most recently updated as WCAG 2.2, which adds new success criteria and clarifies scope.³ For Australian organizations, inclusion-by-design aligns with the Disability Discrimination Act and current government guidance that positions WCAG conformance as the baseline for equal access to digital goods and services.⁴ The approach sets explicit acceptance criteria, invests in inclusive research, and integrates assistive technology scenarios into test plans so accessibility is verified, not assumed. This turns compliance into capability.
Where is the gap between intention and reality today?
Leaders often assume teams already “cover accessibility,” yet data tells a different story. The WebAIM Million study, which scans the top one million home pages annually, continues to find widespread WCAG failures, with persistent issues such as low-contrast text, missing alternative text, and unlabeled form inputs.⁵ These failures are not edge cases. They signal systemic process gaps in content governance, design tokens, component libraries, and release controls. The lesson is clear. Without policy, patterns, and pipeline checks, accessibility debt grows faster than teams can remediate. The result is customer churn, higher support costs, and reputational risk.
How do standards and laws translate into service transformation?
Standards remove ambiguity. WCAG 2.2 defines testable success criteria that translate into design system tokens, component specifications, and QA scripts.³ Australian policy guidance reinforces this, linking accessibility to consistent service quality across the public sector and its suppliers.⁶ The Disability Discrimination Act sets expectations for equal access to services and provides an enforcement backdrop.⁷ When leaders map these requirements into service blueprints, they shift from ad hoc fixes to scalable controls. Procurement embeds accessibility in vendor selection. Architecture decisions consider keyboard operability, focus management, and error prevention. Operations monitor accessibility metrics alongside NPS and resolution rates. Compliance becomes an outcome of good service design.
How does inclusion-by-design improve customer and business outcomes?
Accessible services reduce effort for everyone. Clear labels, adequate contrast, predictable navigation, and resilient error handling lower cognitive load and support faster task completion. Organizations that increase inclusivity also expand total addressable market, protect conversion, and lift loyalty among customers and employees who benefit from inclusive practices. External research links broader inclusion in leadership to higher odds of financial outperformance, which aligns with the experience of teams that embed accessibility as a management practice rather than a remedial task.⁸ The economics are straightforward. Lower avoidable contacts, fewer abandoned tasks, and reduced legal exposure compound into strong ROI. Leaders who set accessibility as a KPI see improvement because the organization plans and funds accordingly. Industry surveys show digital accessibility moving up the priority stack, but gaps remain where programs lack executive sponsorship and measurement discipline.⁹
What mechanisms make accessibility repeatable and reliable?
Executives standardize outcomes by shaping three levers: governance, systems, and skills. Governance sets policy and accountability. Systems encode the rules in design tokens, components, and automated tests. Skills build capability across roles so teams can make good decisions at speed. WCAG criteria become reusable patterns with accessible defaults for color, spacing, focus, form behavior, and error messaging.³ Continuous integration runs automated checks to catch regressions before release. Content operations incorporate plain language and structured authoring so editors can meet reading and assistive technology needs. When this scaffolding is in place, accessibility is no longer heroic. It is routine and resilient, even as teams ship faster.
How should leaders stage the transformation across channels?
Executives prioritize journeys with the highest value and the highest risk. Start with the moments that matter for customers who rely on assistive technologies. Map the top tasks customers attempt on web, app, voice, and assisted channels. Validate them with users who have diverse access needs. Address high-severity WCAG issues first because they block completion and drive complaints.³ Move next to pattern-level improvements in component libraries to scale the fix across properties. Train frontline teams to recognize and resolve accessibility barriers in service interactions so customers receive equitable outcomes regardless of channel. Align call center knowledge and scripting with inclusive language and procedures. This staged approach delivers early wins while building the foundation for sustained improvement.
Which metrics prove accessibility and equity are improving?
Leaders make progress visible by measuring both conformance and experience. Conformance metrics track WCAG success criteria coverage and defect density. Experience metrics track task success and time on task for customers using assistive technologies. Process metrics track design system adoption and automated check pass rates. Insights triangulate with market signals such as reduced abandonment, higher conversion, and fewer accessibility-related complaints. External data on the prevalence of significant disability and the scale of spending power among disabled customers provides context for targets and business cases.¹ ² Publishing an accessibility statement and roadmap signals commitment and sets the rhythm for continuous improvement.
What risks arise when accessibility is treated as a compliance afterthought?
Treating accessibility as a late gate introduces delay, cost, and legal exposure. Remediation after development is expensive and brittle. Customers who face barriers will seek alternatives, leave negative reviews, or escalate to regulators. For public sector agencies, inaccessible services undermine trust and can violate policy.⁶ For private enterprises, brand and revenue risks compound when accessibility issues intersect with vulnerable customer scenarios such as affordability programs or hardship processes. The deeper risk is cultural. If teams learn that accessibility can be deferred, they prioritize speed over stewardship and ship inequity by default. Leaders prevent this by making accessibility a non-negotiable definition of done.
How do you operationalize inclusion-by-design across the enterprise?
Executives hardwire inclusion with a simple playbook. Set policy that names WCAG 2.2 as the standard, defines roles, and assigns accountability to product owners.³ Align procurement to require conformance and evidence. Build or adopt an accessible design system with tested components. Instrument automated checks in CI pipelines and pair them with manual audits and assistive technology testing for critical flows. Publish an accessibility statement and remediation roadmap. Train designers, writers, engineers, testers, and frontline staff. Integrate accessibility into quarterly business reviews with clear targets and funding. Reference national guidance to ensure alignment with local expectations and with the Disability Discrimination Act.⁴ ⁶ ⁷ This creates a loop where policy drives systems, systems drive behavior, and behavior improves outcomes.
What impact should leaders expect in year one and year two?
Year one should focus on risk reduction and foundational capability. Expect a sharp drop in high-severity defects, clearer content patterns, and fewer avoidable contacts as top tasks become accessible. By year two, the organization should see sustained conversion lift, faster delivery from reusable accessible components, and improved employee engagement as teams work with clearer standards. Market opportunity grows as more customers can complete tasks without assistance. The work compounds because inclusion-by-design reduces rework and strengthens the service experience end to end. As external studies show, organizations that lean into inclusion tend to outperform peers over time, which is consistent with the operational benefits of accessible service design.⁸
FAQ
What is inclusion-by-design in Customer Experience and Service Transformation?
Inclusion-by-design is the practice of embedding accessibility and equity requirements into strategy, research, design, build, and operations so services meet WCAG standards and deliver equal access by default.³ ⁴
Why does the scale of disability justify immediate investment?
The WHO estimates 1.3 billion people, or one in six globally, live with significant disability, which highlights a large customer base affected by inaccessible services.¹
Which standard should organizations use to guide digital accessibility?
Organizations should use WCAG 2.2, the current W3C web accessibility standard that adds new success criteria and clarifies requirements for modern interfaces.³
How does Australian policy influence accessibility programs?
Australian guidance positions accessibility as essential for equal access to digital goods and services and aligns with obligations under the Disability Discrimination Act.⁴ ⁷
Which common failures should teams fix first on websites and apps?
Prioritize high-severity WCAG issues that block task completion, such as low-contrast text, missing alternative text, and unlabeled form inputs, which remain common on large portions of the web.⁵
What business outcomes link to inclusive design and leadership?
Independent research associates greater executive-level diversity with higher odds of financial outperformance, reinforcing the commercial case for inclusive practices.⁸
Which market signals support the commercial case for accessibility?
The UK’s Purple Pound estimates the annual spending power of disabled people and their households at £274 billion, illustrating the economic upside of accessible services.²
Sources
World Health Organization. “Disability and health.” 2023. WHO Fact Sheet. https://www.who.int/news-room/fact-sheets/detail/disability-and-health
Scope. “Attracting more disabled customers and the Purple Pound.” 2023. Scope for Business. https://business.scope.org.uk/disabled-customers-purple-pound/
W3C Web Accessibility Initiative. “What’s New in WCAG 2.2.” 2023. W3C. https://www.w3.org/WAI/standards-guidelines/wcag/new-in-22/
W3C WAI. “Australia: Guidelines on equal access to digital goods and services.” 2025. W3C Policy. https://www.w3.org/WAI/policies/australia/
WebAIM. “The WebAIM Million: The 2024 report on the accessibility of the top 1,000,000 home pages.” 2024. WebAIM. https://webaim.org/projects/million/2024
Digital Transformation Agency. “Accessibility.” 2025. Australian Government DTA. https://www.dta.gov.au/accessibility
Centre for Accessibility Australia. “Website Accessibility and the Disability Discrimination Act 1992.” 2024. Centre for Accessibility Australia. https://www.accessibility.org.au/policy/website-accessibility/
McKinsey & Company. “Diversity wins: How inclusion matters.” 2020. McKinsey. https://www.mckinsey.com/~/media/mckinsey/featured%20insights/diversity%20and%20inclusion/diversity-wins-how-inclusion-matters/diversity-wins-how-inclusion-matters-vf.pdf
Level Access. “The State of Digital Accessibility: 2022 Survey Report.” 2022. Level Access. https://www.levelaccess.com/resources/state-of-digital-accessibility-report-2022/