


Why should service operations measure their environmental footprint?
Service leaders face rising pressure from boards, customers, and regulators to prove that service operations create value with less environmental cost. Executives must treat environmental performance as a core service quality attribute, not an afterthought. Service operations include contact centres, field service, digital channels, and the enabling technology stack. These units consume electricity, procure equipment, travel to customer sites, and commission third parties. Each activity generates greenhouse gas emissions across Scope 1, Scope 2, and Scope 3 under the Greenhouse Gas Protocol, the dominant corporate accounting standard.¹ Tracking these scopes in service contexts creates a common language between sustainability teams and operational leaders, which speeds action and reduces reporting risk.¹ When leaders define the footprint clearly, they unlock targeted improvements rather than broad and blunt programs. The work starts with an operational map and a shared carbon baseline.¹
What counts as the footprint in a service context?
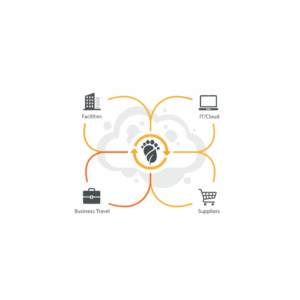
Service operations rarely combust fuel directly, so Scope 1 is often minimal. The real signal sits in Scope 2 electricity use and Scope 3 purchased goods and services, business travel, employee commuting, and use of sold services.¹ Electricity intensity spikes in digital-first services due to data centres, networks, devices, and the office estate that supports service teams. Global assessments show digital infrastructure consumes a measurable and growing share of electricity, which makes energy management a primary lever for service leaders.² ³ Procurement choices for headsets, laptops, networking gear, and furniture add upstream emissions. Business travel and contractor miles add downstream emissions. A practical footprint boundary starts with four clusters, then expands: facilities and workspace, IT and cloud services, employee equipment, and external suppliers. This boundary mirrors standard greenhouse gas categories and aligns with financial control, so it integrates into budgeting and performance reviews.¹
Where do data centres and cloud services fit?
Cloud and colocation providers aggregate computing demand from many enterprises. They offer superior efficiency per unit of compute when compared with typical on-premises setups, and they purchase large volumes of renewable electricity through power purchase agreements. Public reporting and international tracking indicate that data centre electricity demand continues to rise with AI and streaming, while efficiency initiatives and clean power purchases work to moderate emissions growth.² ³ For service leaders, the implication is clear. Choose efficient regions, right-size instances, and schedule batch workloads to run when grids are cleaner. Measure with cloud carbon tools, then integrate results into monthly service performance packs. Prioritise serverless and managed services that reduce idle time. Validate provider claims by asking for location-based and market-based Scope 2 disclosures that conform to the Greenhouse Gas Protocol and follow emerging guidance from the Science Based Targets initiative for service and ICT firms.¹ ⁴ ⁵
How do we build a defensible baseline for service operations?
Executives need a baseline that holds up under audit and informs decisions. Use the Greenhouse Gas Protocol Corporate Standard to set organisational and operational boundaries, then select activity data that finance already trusts.¹ Gather electricity consumption from meters or invoices, cloud usage from provider dashboards, and travel from booking systems. Convert activity to emissions using location-based grid factors for the countries you serve, then reconcile to market-based factors when renewable energy certificates or power purchase agreements apply.¹ Document data sources, factors, and assumptions. Treat data lineage as you would treat a financial reconciliation. Version control the model. Map emissions to service units like contact centres, field service, and digital channels. That map translates carbon into operational levers such as average handle time, first contact resolution, truck rolls, and shift scheduling. Audit readiness increases when the inventory follows ISO 14001-aligned environmental management system practices.⁴
Which levers reduce the footprint without hurting service levels?
Service leaders hold operational levers that reduce emissions while protecting customer outcomes. Start with load shaping. Optimise schedules and routing to align labour and energy with demand. Improve first contact resolution to avoid repeat interactions. Shift demand to digital self-service that solves the full task, not just deflects the call. Improve knowledge management and agent assist so each resolution requires less compute and fewer transfers. Tune cloud workloads and storage classes to reduce idle resources. Relocate intensive jobs to cleaner regions when latency allows. Replace old devices at the point where efficiency gains offset embodied carbon, using supplier take-back programs. Improve building efficiency by tightening temperature set points, lighting controls, and occupancy-based power management aligned to national office energy frameworks.³ ⁴ Embed low-carbon travel policies for field service, using route optimisation, electric vehicles where feasible, and virtual diagnostics. Align targets with the Science Based Targets initiative so reductions map to a credible net zero pathway.⁵
How should leaders integrate environmental metrics into service performance?
Service operations run on dashboards and reviews. Add emissions intensity metrics alongside service level, cost, and quality. Use a small set of ratios that operations teams can steer. Examples include kilograms of CO₂e per contact resolved, per field job completed, and per dollar of service revenue. Build the metrics from the same systems that supply operational KPIs, and tie them to budgets. Set targets that are internally consistent with corporate climate commitments and the sector context tracked by credible agencies.² ³ Use monthly performance reviews to highlight where emissions move in step with operational drivers. Reward teams for hitting intensity targets while protecting customer outcomes. Use ISO 14001 management system practices to drive corrective actions and management reviews at least annually.⁴ Embed carbon considerations into change governance so new initiatives show an emissions impact estimate in the business case, and apply SBTi guardrails to confirm compatibility with your net zero plan.⁵
What is the role of procurement and vendor management?
Procurement decisions drive a large share of service emissions through Scope 3 categories.¹ Leaders should require supplier disclosures that follow the Greenhouse Gas Protocol, request life cycle assessments for key equipment, and assess cloud and network providers on energy and carbon transparency. Vendors that publish location-based and market-based emissions, renewable energy share, and science-based targets deserve preference.¹ ⁵ Embed environmental criteria into request for proposal templates and scorecards. Require suppliers to operate an environmental management system that aligns with ISO 14001 and to share improvement plans each year.⁴ Include a clause for continuous efficiency in managed service contracts. Track supplier progress quarterly and escalate gaps through vendor governance. The contract becomes a tool for joint performance improvement, not just a compliance document. This approach builds resilience and reduces risk of stranded service designs as regulation tightens. It also pushes learning across the partner network.
How do AI, knowledge automation, and contact centres change the equation?
AI workloads add new compute intensity to customer service. Conversational AI, summarisation, and agent assist can reduce handling time and error rates, yet they raise questions about energy use per interaction. The answer is to measure before and after. Capture emissions per resolved ticket across human-only, hybrid, and automated flows. Use provider tools to estimate model and inference energy, and consolidate results into the same inventory that covers facilities and networks.² ³ Select models sized to the task and cache results where accuracy allows. Retire redundant automations that no longer improve outcomes. Move training to cleaner regions and schedule inference windows to match renewable supply where feasible. Maintain human oversight to preserve service quality and trust. Align target setting with the corporate science-based pathway to avoid local optimisation that conflicts with long term goals.⁵ This disciplined approach keeps innovation productive and the footprint visible.
How do we govern change and keep the system honest?
Governance converts good intent into durable practice. Establish an environmental policy for service operations that binds leaders to specific standards. Align audits and management reviews to ISO 14001 practice.⁴ Anchor disclosures to the Greenhouse Gas Protocol and publish a methods paper with boundaries, factors, and data sources.¹ Disclose progress against science-based targets to maintain credibility with investors and employees.⁵ Use a quarterly forum where operations, finance, IT, and sustainability review the emissions dashboard, approve corrective actions, and close actions. Train leaders and frontline managers on carbon literacy for service contexts. Incentivise improvements in bonus plans. Keep the cost lens present. Many energy and efficiency measures deliver cost savings in parallel with emissions reductions when electricity prices are volatile.² ³ Treat the work as a continuous improvement program that evolves with the grid, the supplier mix, and the service design roadmap.
What impact should executives expect in the first 12 months?
Executives can expect a defensible baseline, a visible set of intensity metrics, and a pipeline of initiatives that reduce emissions with neutral or positive service impact. Facilities and IT tuning often deliver measurable savings within quarters.³ Supplier transparency improves as contracts refresh. Training builds literacy and momentum. By year end, the service organisation should demonstrate alignment with ISO 14001 practices, advanced reporting under the Greenhouse Gas Protocol, and a trajectory consistent with the Science Based Targets initiative.¹ ⁴ ⁵ This path reduces regulatory risk, improves brand trust, and frees budget through avoided energy and consumption. It also aligns service excellence with sustainability so teams see environmental outcomes as a natural extension of customer outcomes.
What are the next steps for Customer Experience and Service Transformation leaders?
Leaders should appoint an accountable owner, set the boundary, and build the baseline. They should instrument cloud and facility telemetry, publish the first emissions intensity dashboard, and embed environmental criteria into supplier governance. They should run a quarterly review, adopt ISO 14001 practices, and declare a science-based target.¹ ⁴ ⁵ These steps create a living system that learns as service designs evolve. The result is a service operation that serves customers with fewer resources, lower risk, and higher trust. That is the standard customers expect and regulators now monitor.² ³
FAQ
How does the Greenhouse Gas Protocol apply to service operations at Customer Science?
The Greenhouse Gas Protocol provides the accounting rules that let service leaders classify emissions into Scope 1, Scope 2, and Scope 3 for activities like electricity use, procurement, business travel, and cloud services. Customer Science applies these rules to contact centres, field service, and digital channels to build a defensible baseline and intensity metrics.¹
What is the most material emissions source for digital customer service?
The most material sources are typically Scope 2 electricity for facilities and cloud services, plus Scope 3 purchased goods and services from suppliers and partners. International tracking shows data centre electricity demand is significant, so energy management and efficient cloud design are primary levers.² ³
Which standards should my service function align to for credibility?
Service functions should align to the Greenhouse Gas Protocol for accounting, ISO 14001 for environmental management systems, and the Science Based Targets initiative for target setting and disclosure.¹ ⁴ ⁵
Why do cloud and data centre choices matter to CX leaders?
Cloud region selection, workload right-sizing, and provider renewable energy procurement influence emissions intensity per interaction. Leaders should request location-based and market-based disclosures and use provider carbon tools to track and optimise.¹ ³ ⁵
How can AI in contact centres reduce emissions without risking service quality?
AI can cut handling time and repeat contacts, which lowers energy per resolved case. Leaders should measure emissions per resolution before and after AI deployment, choose appropriately sized models, cache results where accuracy allows, and schedule workloads in cleaner grid windows.² ³
Which procurement actions move the needle fastest in service operations?
Procurement can require supplier GHG reporting, ISO 14001-aligned management systems, and science-based targets. Contracts should include continuous efficiency clauses and quarterly reporting to drive joint improvements.¹ ⁴ ⁵
What does success look like in the first year for a Customer Science client?
Success includes a verified baseline, a live emissions intensity dashboard, tuned facilities and cloud workloads, improved supplier transparency, and alignment with ISO 14001 and science-based targets. These outcomes reduce cost and risk while improving customer trust.¹ ⁴ ⁵
Sources
Greenhouse Gas Protocol Corporate Accounting and Reporting Standard, WRI and WBCSD, 2004, Standard. https://ghgprotocol.org/corporate-standard
IPCC AR6 Synthesis Report, Core Writing Team, 2023, Intergovernmental Panel on Climate Change. https://www.ipcc.ch/report/ar6/syr/
Data Centres and Data Transmission Networks, 2024, International Energy Agency, Tracking Clean Energy Progress. https://www.iea.org/energy-system/buildings/data-centres-and-data-transmission-networks
ISO 14001:2015 Environmental Management Systems, 2015, International Organization for Standardization. https://www.iso.org/standard/60857.html
SBTi Corporate Net-Zero Standard, 2021, Science Based Targets initiative. https://sciencebasedtargets.org/resources/files/Net-Zero-Standard.pdf