


Why do hypotheses belong in every service transformation?
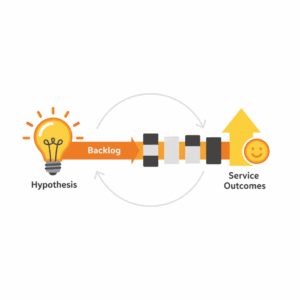
Leaders improve services when they treat change as a set of testable bets. A hypothesis frames a belief about value, defines a measurable signal, and anchors the smallest slice of work that can prove or disprove the idea. This approach reduces waste, speeds learning, and aligns teams around evidence instead of opinion. Lean practitioners popularized the loop of build, measure, learn to reduce uncertainty in product and service delivery.¹ Scrum teams reinforce this loop with short iterations, clear goals, and empirical inspection to adapt.² When executives pair hypotheses with disciplined backlogs and explicit service outcomes, transformation becomes a repeatable operating system rather than a heroic effort. Hypotheses reduce the cost of being wrong. Backlogs translate bets into work. Outcomes close the loop by proving impact in the real world.
What is a service hypothesis, in plain business terms?
A service hypothesis is a concise statement that links an observed customer problem to an expected outcome and a measurable signal. A practical template reads: We believe [customer segment] will achieve [desired outcome] if we deliver [change], which we will know is true when we see [metric move] by [timeframe]. This structure makes intent, audience, and evidence explicit. The best hypotheses draw on customer jobs, which are the progress customers try to make in a given situation.³ When leaders sponsor hypotheses at the portfolio level, they create clarity about which problems matter and how success will be judged. This clarity reduces solution bias and focuses investments on outcomes rather than outputs. It also encourages cross-functional collaboration, because marketing, operations, digital, and contact centres can all contribute to the same outcome signal.
How should backlogs evolve to support hypothesis-driven work?
Backlogs should shift from lists of features to structured queues of experiments, enabling work to move from discovery to delivery without losing the learning thread. Modern backlogs include three layers. First, an outcomes layer that records the service metrics an initiative intends to move. Second, a hypotheses layer that expresses the bets that could move those metrics. Third, a delivery layer that breaks a given hypothesis into the smallest observable increments. This structure respects the Double Diamond pattern of diverging and converging through discovery and definition, then development and delivery.⁴ Teams preserve context by linking each task to the hypothesis and outcome it serves. Leaders then sequence the backlog by value and risk, not by stakeholder volume. Executives gain a transparent view of why work exists, what learning has occurred, and whether the next increment still deserves funding.
Where do service outcomes fit, and how do we define them?
Service outcomes are quantitative, customer-anchored measures that reflect whether a service helped people achieve their goals. Outcomes differ from output metrics because they capture effectiveness and reliability in the customer’s context. Strong service outcomes blend experience, operational, and financial signals. A typical service portfolio tracks journey completion rates, time to value, failure demand in contact centres, cost to serve, and net satisfaction or advocacy. Net Promoter System guidance positions recommendation likelihood as one proxy for loyalty when used with driver analysis and closed-loop learning.⁵ For digital delivery outcomes, many organizations complement service measures with software delivery performance indicators such as deployment frequency, change lead time, change failure rate, and time to restore.⁶ The point is simple. Choose a small set of credible signals that a real customer would recognize as progress.
How do hypotheses, backlogs, and outcomes connect in flow?
Teams connect these elements through a simple governance rhythm. Leaders set quarterly service outcomes and budget ranges. Teams propose hypotheses that plausibly move those outcomes. Product, operations, and service owners refine hypotheses into small experiments and backlog items. Each sprint or cycle, teams deliver increments, measure the defined signals, and publish learning notes. Portfolio reviews then compare cost, learning velocity, and outcome movement to reallocate funding. Scrum’s empirical pillars of transparency, inspection, and adaptation provide the cadence for this learning system.² Evidence-Based Management practices add a shared vocabulary for current value, time to market, ability to innovate, and unrealized value, which helps executives decide where to invest next.⁷ When these mechanisms align, governance becomes a venue for choosing the next best bet, not a forum for defending sunk costs.
What makes a good hypothesis testable and ethical?
A strong hypothesis names a customer segment, states an expected benefit, and sets a clear threshold for success. It proposes the smallest slice of change that could reveal a signal. It plans guardrails that protect customers and staff, including opt-outs and service recovery steps. Many teams use service blueprints to map frontstage and backstage interactions, which surfaces risks before testing.⁸ Ethical hypotheses respect privacy by limiting data collection to what is necessary and by explaining the test to affected customers in accessible language. Leaders sponsor this discipline by rewarding learning speed and quality, not just positive results. When leaders celebrate meaningful invalidations, teams feel safe to run sharper tests that protect people and capital.
How do we compare feature roadmaps and hypothesis roadmaps?
Feature roadmaps forecast delivery of solutions. Hypothesis roadmaps forecast learning about value. The former optimizes for predictability of outputs, while the latter optimizes for reliability of outcomes. Feature roadmaps help align dependencies when the problem and solution are well understood. Hypothesis roadmaps help explore uncertainty when customer jobs, constraints, or economics are still in flux. Lean enterprise practice recommends making uncertainty visible and reducing batch size to accelerate validated learning.¹ When teams must present timelines, they show learning milestones and decision points rather than fixed output dates. Leaders stay flexible on solution shape while staying firm on outcome targets. This stance keeps governance honest. It accepts that plans change while insisting that intent does not.
Which metrics best reflect service outcomes without distortion?
Executives should choose a small set of stable, decision-worthy measures. A balanced set might include customer effort for key journeys, first contact resolution for priority intents, on-time service completion, task success in digital channels, and unit cost per resolved intent. To avoid metric gaming, teams publish operational definitions, data sources, and sampling methods. Evidence-based frameworks advise checking both lagging and leading indicators.⁷ Delivery metrics from the DORA research program are helpful leading signals for the capability to change services safely and quickly.⁶ Experience measures such as NPS or satisfaction should be paired with qualitative feedback and driver analysis to identify causation rather than correlation.⁵ Finally, teams review metric health quarterly to retire vanity indicators and refine definitions so that measures keep pace with the service.
How do contact centres participate in hypothesis-driven transformation?
Contact centres hold rich signals about failure demand, language, and intent. Leaders can turn these signals into hypotheses that reduce avoidable demand and improve first contact resolution. Start by mining contact reasons and mapping them to journeys. Propose bets such as clearer status communications, proactive notifications, or simplified authentication. Attach each bet to an expected impact on call deflection, average handling time for the remaining contacts, and customer sentiment. Deliver the smallest change that could reveal a signal, then learn fast. As digital and voice channels converge, centres also become controlled environments for A/B tests on scripts, prompts, and knowledge assets. The outcome lens ensures that changes reduce customer effort in real situations, not just in the lab.
What operating model changes sustain this way of working?
Organizations sustain hypothesis-driven service transformation by tuning four elements. First, funding shifts from projects to persistent products and services with clear outcomes. Second, governance cadences move from stage gates to regular evidence reviews where leaders ask what we learned, what it cost, and what we will change. Third, capability building expands beyond delivery to include discovery skills such as research, experiment design, and service blueprinting. Fourth, performance management rewards teams for outcome movement and learning velocity. These changes align with agile and service design practices that emphasize iterative discovery, empowered teams, and customer value.² ⁴ ⁸ The operating model becomes a portfolio of services that improve through disciplined experiments rather than sporadic initiatives.
How do we start tomorrow with no extra budget?
Leaders can begin with a three-sprint protocol. In sprint one, select one service outcome and write three hypotheses that could move it. In sprint two, design and run the smallest safe experiments to observe a signal. In sprint three, make a funding decision based on evidence and publish a learning note to the portfolio. Use existing backlogs and ceremonies. Add only what makes learning visible. Share results with a one-page template that records the hypothesis, the change, the signal, the data, and the decision. As results accumulate, patterns emerge about which types of bets move which outcomes for your customers. That pattern library becomes a strategic asset. It guides where to place the next bet and where to stop.
What are the common risks and how do we manage them?
Common risks include vanity metrics, solution bias, and slow decision cycles. Leaders counter vanity metrics by defining outcomes that customers would recognize as progress and by publishing definitions. They counter solution bias by requiring at least two alternative hypotheses per problem and by allocating a small budget for disconfirming evidence. They counter slow decisions by setting a decision cadence and empowering service owners to make calls within guardrails. Service blueprints expose backstage constraints that would otherwise surface late, which reduces risk to customers and staff.⁸ Evidence-Based Management gives executives a way to compare options across value, time to market, and innovation capacity, which accelerates allocation.⁷ Good risk management is simply good hypothesis practice. It creates a safe path to find truth faster.
How do we measure impact across the enterprise?
Enterprises measure impact at three levels. At the team level, track whether experiments produced the predicted signal within the timeframe. At the product or service level, track whether outcomes moved quarter on quarter. At the portfolio level, track learning velocity and investment efficiency. OKRs help link outcomes to strategy when written as measurable changes in customer and business results.⁹ Publish a quarterly portfolio review that summarizes the hypotheses tried, the cost of learning, the outcome movement, and the decisions taken. Transparency builds trust. Trust earns runway. Runway creates space to transform services with discipline and speed.
Practical playbook: from idea to impact in six moves
Define the service outcome that matters for the next quarter.
Write three customer-anchored hypotheses that could move it.
Blueprint the service to find the smallest safe slice.⁸
Sequence a backlog of increments that preserve learning context.
Run the experiments, capture signals, and publish learning notes.
Reallocate funding based on evidence at your governance cadence.² ⁷
FAQ
What is a service hypothesis and why does it matter in Customer Experience and Service Transformation?
A service hypothesis is a clear statement linking a customer problem to an expected outcome and a measurable signal. It matters because it turns change into testable bets, reduces waste, and aligns backlogs and funding to outcomes that customers recognize as progress.¹ ² ³
How should Agile Service Innovation teams structure backlogs to support experiments?
Teams should maintain three connected layers in the backlog: outcomes to move, hypotheses that may move them, and delivery tasks that enact the smallest testable slice. This preserves learning context from discovery through delivery and aligns with the Double Diamond cadence.⁴
Which service outcomes should contact centres and CX leaders prioritize first?
Prioritize a balanced set that includes journey completion, first contact resolution, avoidable demand, time to value, and cost to serve, paired with experience signals such as satisfaction or advocacy and qualitative feedback for root causes.⁵ ⁶
Why pair Scrum with Evidence-Based Management for service innovation?
Scrum provides the cadence for transparency, inspection, and adaptation. Evidence-Based Management adds a portfolio language for current value, time to market, ability to innovate, and unrealized value, helping leaders allocate investment based on evidence.² ⁷
Which delivery metrics help predict service agility and reliability?
Delivery performance indicators from the DORA research program help. Track deployment frequency, lead time for changes, change failure rate, and time to restore service to understand the capability to change safely and quickly.⁶
What is the role of service blueprints in hypothesis-driven change?
Service blueprints map frontstage and backstage interactions. They reveal risks, dependencies, and opportunities for the smallest safe test of change, protecting customers and staff while accelerating learning.⁸
Which governance cadence supports outcomes without adding bureaucracy?
Adopt a quarterly outcomes and funding rhythm with sprint-level experiments and evidence reviews. Use OKRs to link outcomes to strategy, and reallocate investment based on learning and movement in the defined signals.² ⁷ ⁹
Sources
The Lean Startup — Eric Ries — 2011 — Crown Business. https://theleanstartup.com/
The Scrum Guide — Ken Schwaber and Jeff Sutherland — 2020 — Scrum Guides. https://scrumguides.org/scrum-guide.html
Know Your Customers’ Jobs to Be Done — Clayton M. Christensen, Taddy Hall, Karen Dillon, David S. Duncan — 2016 — Harvard Business Review. https://hbr.org/2016/09/know-your-customers-jobs-to-be-done
The Double Diamond: A universally accessible design process — Design Council — 2019 — Design Council. https://www.designcouncil.org.uk/our-work/skills-learning/tools-frameworks/the-double-diamond/
Net Promoter System — Bain & Company — 2023 — Bain. https://www.netpromotersystem.com/about/
DORA Accelerate: Research and Metrics — Nicole Forsgren, Jez Humble, Gene Kim et al. — 2021 — DORA. https://dora.dev/research/
Evidence-Based Management Guide — Scrum.org — 2023 — Scrum.org. https://www.scrum.org/resources/evidence-based-management
Service Blueprints: Definition — Kate Kaplan — 2019 — Nielsen Norman Group. https://www.nngroup.com/articles/service-blueprints-definition/
What Matters: OKRs — John Doerr and the What Matters team — 2018 — WhatMatters.com. https://www.whatmatters.com/