


Why executives should treat data quality like a product reliability program
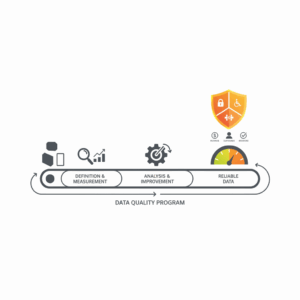
Leaders measure data quality to protect decisions, customers, and revenue. Good data quality reduces rework, speeds change, and prevents poor customer experiences at the edge. Data quality is the degree to which data meets requirements for an intended use. This “fit for purpose” concept anchors standards such as ISO 8000 and the ISO 25012 data quality model, which formalize characteristics and measures for evaluating data used in computer systems.¹² Data quality management matured from Total Data Quality Management research, which framed an iterative cycle of definition, measurement, analysis, and improvement.³ When executives apply this discipline to customer operations, contact center analytics, and service workflows, they move from reactive cleanups to predictable performance. The goal is not perfect data. The goal is reliable data that meets explicit requirements and is measured against clear thresholds.²
What is data quality and which dimensions matter most
Teams define data quality with measurable dimensions. Common dimensions include completeness, accuracy, consistency, timeliness, validity, and uniqueness. DAMA bodies of knowledge catalogue these dimensions and show how the same dimension can apply to values, records, or attributes.⁴⁵ ISO 25012 groups attributes into inherent and system dependent categories to separate properties of the data itself from properties introduced by storage and processing.² A usable definition keeps each dimension observable. Completeness is the proportion of required values present. Accuracy is the agreement with a trusted reference. Consistency is the absence of conflicts across sources. Timeliness is the age of data relative to need. Validity is conformity to type and business rules. Uniqueness is the absence of unintended duplicates. These definitions support objective tests and trend monitoring across customer, channel, and operational datasets.²⁵
How do you turn dimensions into operational metrics and targets
Executives convert dimensions into metrics and service level objectives. Site Reliability Engineering uses SLIs and SLOs to quantify reliability; data leaders can do the same for data products.⁶⁷ A service level indicator for completeness might be the percentage of customer records with a valid contact method in the last 24 hours. A service level objective might set a target of 99.5 percent with an error budget that triggers remediation when breached.⁷ Targets vary by workflow. Fraud models need tighter timeliness and validity than monthly experience dashboards. ISO 25012 supports the creation of measurable requirements and evaluation plans, which aligns with setting enterprise SLOs for data products consumed by contact center, marketing, and finance teams.² The discipline is to write the metric, define the source of truth, publish thresholds, and link breach response to business impact.
Which formulas and thresholds work in practice
Teams start with simple, defensible formulas. Completeness equals required fields present divided by required fields expected. Validity equals records passing rule checks divided by total records evaluated. Accuracy equals sampled values matching a trusted reference divided by sampled values. Timeliness equals current time minus last successful load time. Consistency equals records without cross table conflicts divided by total records checked. Uniqueness equals distinct business keys divided by total records. DAMA and ISO materials show how dimensions can be decomposed by data concept so a team can track completeness for values, records, and attributes separately.⁴²⁵ For contact center data, leaders often measure agent identifier validity, interaction timestamps within tolerance, and case status consistency across CRM and telephony systems. These metrics fit nicely into SLI and SLO dashboards that business owners can interpret.⁷
How do you instrument pipelines to collect the metrics
Teams instrument data pipelines with rule based checks, statistical monitors, and lineage capture. Open source frameworks such as Great Expectations let engineers declare expectations about schema, ranges, sets, and relationships, then publish human readable validation results.⁸⁹ Airflow, as a common orchestrator, supports placing checks before and after transformations and routing failures to alerts or quarantine paths.¹⁰¹¹ Managed tools like Soda provide ready made checks and Airflow integrations for production scans.¹ Observability platforms popularized freshness, distribution, volume, schema, and lineage as five pillars of continuous health monitoring. These pillars map directly to the core dimensions and make the metrics easy to trend and alert.¹³¹⁴ Instrumentation should run where failures are most likely and least costly to fix, which is usually at ingestion boundaries and model feature stores.¹⁰
What role does data lineage play in measuring reliability
Lineage reveals how upstream changes propagate into downstream metrics and experiences. OpenLineage defines a vendor neutral model of datasets, jobs, and runs with events that describe job starts, completions, and I O relationships. This standard allows organizations to compute lineage coverage, change impact scope, and mean time to detect source disruptions.¹⁵¹⁶¹⁷ Major clouds and catalogs integrate with OpenLineage, which makes lineage telemetry portable across tools.¹⁸ When lineage events are present, teams can correlate quality incidents with upstream schema changes or volume drops. That correlation shortens time to restore service and supports post incident reviews that fix root causes. For regulated environments, lineage also strengthens evidentiary trails for audits and for customer data rights requests by showing how data moved and transformed through systems.¹⁵
How do you compare rule based validation and observability
Rule based validation asserts what should be true for a dataset. It excels when rules are stable and tied to business definitions such as allowable statuses, valid product codes, or referential integrity. Great Expectations formalizes these assertions and publishes results teams can read.⁸ Observability monitors what actually happens to a dataset over time. It excels at detecting drift, anomalies, and silent breakages by tracking freshness, volumes, distributions, and schema changes.¹³ A balanced program combines both. Rules protect the known and expected. Observability finds the unknown and unexpected. Airflow or similar orchestrators coordinate execution, retries, and alerts.¹⁰ Leaders who blend both approaches report fewer production incidents and shorter repair cycles because detection is earlier and diagnostics include both rule failure context and upstream change signals.¹¹¹³
How should you prioritize risks and remediation
Executives should prioritize data quality risks by business impact, likelihood, and detection difficulty. ISO 8000 and DAMA emphasize that requirements drive measurement, which in turn drives remediation priorities.¹⁸⁴ Customer experience teams often rank highest risks as stale contact attributes that block service, misrouted cases due to invalid categories, and broken joins that drop interactions from journey analytics. Observability pillars help quantify likelihood by showing change rates and volatility on critical pipelines.¹³ Lineage helps estimate blast radius during incidents by counting downstream assets and consumers.¹⁵ SLOs provide clear trigger points for incident response.⁷ The remediation plan should include automated reject and quarantine, golden record mastering, and cross system semantic alignment for codes and identifiers. These actions reduce defect recurrence and create durable operational confidence in analytics and AI models.
How do you prove improvement and build trust with the business
Leaders prove improvement by publishing SLI and SLO trend lines, incident counts, mean time to detect, and mean time to resolve. Reliability practices encourage error budgets and post incident reviews that convert lessons into backlog items.⁶⁷ Great Expectations data docs and similar artifacts produce an auditable trail of what was tested, when, and with what results.⁹ Lineage coverage and validation coverage are useful program health metrics that show depth and breadth of protection.¹⁵ Executives should attach these metrics to business outcomes such as handle time, first contact resolution, and model uplift. The linkage clarifies why investment continues and where to target the next round of improvements. ISO 25012 supports periodic evaluations and formal acceptance criteria so that data products move from provisional status to trusted status once metrics meet defined thresholds.²
What next steps move your organization from cleanup to reliability
Organizations mature by treating data as a product with owners, SLOs, and dedicated quality engineering. Leaders pick a critical data product, write the quality requirements, and instrument ingestion and transformation stages with rule based checks and observability monitors.⁸¹³ They connect alerts to on call rotations and define playbooks for quarantine, rollback, and stakeholder communication. They deploy OpenLineage to capture end to end flow and calculate lineage coverage.¹⁵ They publish dashboards with SLIs, SLOs, and error budgets to give the business a live window into reliability.⁷ They update governance policies to include evidence requirements for audits and customer rights requests. When executives sponsor this discipline, contact center and service teams gain reliable insights, model performance improves, and customer experiences become consistent across channels.¹²²
FAQ
What is the most practical definition of data quality for CX leaders?
Data quality is the degree to which data meets explicit requirements for an intended use, often expressed through measurable dimensions like completeness, accuracy, consistency, timeliness, validity, and uniqueness.²⁴⁵
Which data quality metrics should a contact center track first?
Start with completeness of key contact fields, validity of agent and queue identifiers, timeliness of interaction loads, and consistency between CRM and telephony systems. These map to SLIs and SLOs that business owners understand.⁷²⁵
How do rule based checks differ from data observability?
Rule based checks assert expected conditions using frameworks such as Great Expectations, while observability tracks freshness, volume, distribution, and schema to detect drift and silent failures. Use both for coverage.⁸¹³
Why does lineage matter for reliability and auditability?
OpenLineage standardizes lineage events across tools so teams can calculate impact, trace root causes, and produce evidentiary trails for audits and data rights.¹⁵¹⁸
Which standards guide enterprise data quality programs?
ISO 8000 provides an overview of information and data quality principles, and ISO 25012 defines a data quality model and evaluation approach that supports measurable requirements.¹²
How should executives set targets for data quality?
Adopt reliability practices from SRE by defining SLIs and SLOs for each data product with clear thresholds and error budgets, then publish trends and link breach response to business impact.⁶⁷
Which tools help implement checks in pipelines?
Use Great Expectations for declarative validations, Airflow for orchestrating where checks run, Soda for managed production scans, and observability platforms to monitor the five pillars.⁸¹⁰¹²¹³
Sources
-
ISO 8000-1:2022 — Data quality. International Organization for Standardization, 2022. https://www.iso.org/standard/81745.html
-
ISO/IEC 25012:2008 — Data quality model. International Organization for Standardization, 2008. https://www.iso.org/standard/35736.html
-
MIT Total Data Quality Management Program. MIT Information Quality, 2025. https://web.mit.edu/tdqm/
-
DAMA NL — Dimensions of Data Quality. Black & van Nederpelt, 2020, Research Paper. https://www.dama-nl.org/wp-content/uploads/2020/09/DDQ-Dimensions-of-Data-Quality-Research-Paper-version-1.2-d.d.-3-Sept-2020.pdf
-
DAMA NL — Dimensions of Data Quality overview. DAMA Netherlands, 2023. https://dama-nl.org/dimensions-of-data-quality-en/
-
SRE Book — Service Level Objectives. Google, 2023. https://sre.google/sre-book/service-level-objectives/
-
Measuring Reliability with SLIs and SLOs. Google SRE Resources, 2024. https://sre.google/resources/practices-and-processes/measuring-reliability/
-
Great Expectations — Product and docs. GX, 2025. https://greatexpectations.io/
-
Great Expectations — Data Docs reference. GX Docs, 2025. https://docs.greatexpectations.io/docs/0.18/reference/learn/terms/data_docs/
-
Data quality and Airflow. Astronomer Docs, 2025. https://www.astronomer.io/docs/learn/data-quality
-
Apache Airflow — Best Practices. Apache Software Foundation, 2025. https://airflow.apache.org/docs/apache-airflow/stable/best-practices.html
-
Soda — Test data quality in an Airflow data pipeline. Soda Docs, 2025. https://docs.soda.io/use-case-guides/quick-start-prod
-
What Is Data Observability? Monte Carlo, 2025. https://www.montecarlodata.com/blog-what-is-data-observability/
-
Introducing the Five Pillars of Data Observability. Barr Moses, 2020. https://medium.com/data-science/introducing-the-five-pillars-of-data-observability-e73734b263d5
-
OpenLineage — Documentation and Spec. OpenLineage Project, 2025. https://openlineage.io/docs/
-
OpenLineage — GitHub overview. LF AI & Data, 2025. https://github.com/OpenLineage/OpenLineage
-
OpenLineage 101. Atlan, 2023. https://atlan.com/open-lineage/
-
DMBoK Data Quality context and definition. DAMA Rocky Mountain, 2024. https://damarmc.org/news/13443040