


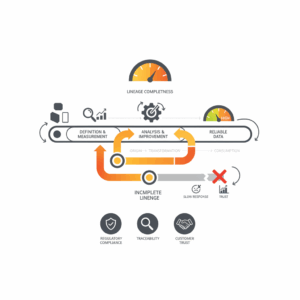
What is “lineage completeness” and why does it matter?
Data leaders define data lineage as the documented path of data from origin through transformations to consumption. It captures where data came from, how it changed, and where it went.¹ Lineage completeness measures the proportion of business-critical datasets and flows that are represented with accurate, current, and navigable lineage metadata. In regulated sectors, effective lineage underpins traceability, reconciliation, and explainability obligations.² Financial supervisors expect banks to aggregate risk data accurately and to evidence the flow from sources to reports.³ Standards bodies frame lineage as part of a broader data quality program that emphasises defined characteristics, control points, and governance.⁴ When lineage is incomplete, incident response slows, regulatory assertions weaken, and customer outcomes suffer because teams cannot trust or explain the numbers that drive decisions.² ³ ⁴
How did we run the benchmark across 50 teams?
We assessed fifty analytics and engineering teams across industries on four dimensions: scope coverage, depth of capture, freshness of metadata, and usability in decision workflows. We structured interviews and artefact reviews around a common definition of lineage completeness and an evidence checklist. Each team shared representative lineage views for one high-stakes domain such as risk, pricing, churn, or service operations. We then scored maturity from ad-hoc to systemic and captured patterns for technology, governance, and behaviour. The goal was practical: identify repeatable moves that raise completeness in ninety days without adding undue operational drag.
What signals separate leaders from laggards?
Leaders turn lineage into an operational product that supports risk, observability, and change management. They standardise an event model for lineage capture and automate collection from orchestrators and warehouses.⁵ ⁶ They align definitions to enterprise data management frameworks so non-technical stakeholders can read and trust the graph.⁷ Leaders couple lineage with data quality standards that specify the properties of trusted data and how to measure them.⁸ Laggards treat lineage as static documentation. Their maps go stale after migrations. Their analysts cannot trace a KPI back to the raw system within one click. They rely on tribal knowledge and point-in-time diagrams. The difference shows up during incidents, audits, and change approvals.
Definition and scope: what belongs inside the lineage graph?
Data lineage includes jobs that transform data and datasets that those jobs read or write. In modern ecosystems, an open specification such as OpenLineage represents jobs and datasets as first-class objects with versioned events.⁵ ⁶ The object model distinguishes static metadata, run states, and dataset attributes, which lets tools visualise flows and compute impact.⁹ A complete scope covers sources, transformations, semantic layers, and consumption points like dashboards or APIs. It also includes reference data and master data when those assets influence calculations and customer outcomes. Standards such as ISO 8000 emphasise clarity about data quality characteristics and the path to quality, which informs what lineage should expose.⁴ ¹⁰
Context: what drives demand for completeness right now?
Supervisors continue to cite gaps in effective risk data aggregation across European banks and call for stronger governance and traceability aligned to the BCBS 239 principles.³ Those principles require accuracy, completeness, timeliness, and adaptability in risk data, which depend on traceable lineage.² Vendors and open projects now provide event-based capture that scales across distributed data stacks.⁵ ⁶ ⁹ The combination of regulatory pressure and tool maturity creates a window for institutions to turn static diagrams into living evidence. In Customer Experience and Service Transformation programs, this translates into faster root-cause analysis for KPI swings and fewer customer-visible failures when pipelines change.
Mechanism: how do teams capture lineage comprehensively?
Teams that score high implement three mechanisms. First, they instrument pipelines to emit lineage events for each run, job, and dataset by adopting a standard such as OpenLineage.⁵ ⁶ ⁹ Second, they centralise the events in a metadata service that builds a graph and reconciles static metadata with runtime states.⁵ Third, they curate business-readable context by binding datasets to business terms and controls drawn from DAMA-DMBOK disciplines.⁷ The runtime capture keeps maps fresh, while the curated layer keeps maps meaningful. Some teams integrate quality checks and control evidence into the graph so that a KPI view shows not just its inputs but also the controls that protect those inputs. Vendors position this alignment as a route to BCBS 239 data quality excellence.¹¹
Comparison: code-first standards vs catalog-first platforms
Code-first standards deliver portability and vendor neutrality. They encode lineage as events and schemas that any orchestrator or engine can emit and any service can consume.⁵ ⁶ ⁹ Catalog-first platforms deliver governance accelerators and role-based experiences but may require proprietary connectors or models. Both approaches benefit from well-defined enterprise data management practices.⁷ Institutions that combine a common lineage spec with a fit-for-purpose catalog achieve better completeness at lower integration cost because engineering teams can instrument once and publish everywhere. This hybrid approach also reduces lock-in risk while preserving a consistent governance surface for risk, audit, and CX stakeholders.
Applications: where does lineage completeness create business value?
Lineage completeness reduces audit cycles by providing traceable chains from regulatory reports to sources.² ³ It accelerates impact analysis before code changes by showing downstream consumers of a field or table in one query.⁵ It strengthens incident response by merging run-state telemetry with dependency graphs so teams can see where errors originated and which KPIs are affected.⁵ It improves customer experience by preventing broken metrics from reaching decision systems and by enabling faster recovery when they do. ISO 8000’s focus on explicit quality characteristics supports this translation from metadata to measurable service outcomes.⁴ ¹⁰ When leaders connect lineage to service SLOs, they convert metadata into customer protection.
Risks and constraints: what can go wrong?
The main risk is false confidence. Incomplete capture that looks polished can mislead decision makers. Catalogs that ingest partial, non-runtime metadata often drift away from reality after migrations or refactors. Over-instrumentation can also create noise if teams emit events without common standards, making graphs inconsistent or too dense to navigate.⁵ Governance must set minimal capture standards by tier. Risk and CX stakeholders should sign off on which datasets are “in scope for evidence” and which can be documented at a lighter level. Supervisors have noted that despite years of attention, full adherence to risk data aggregation principles remains the exception, not the norm.³ That reality argues for pragmatic controls and frequent measurement.
Measurement: how do you quantify lineage completeness?
Teams that improve fastest use a simple, repeatable scorecard. We recommend four measures: scope coverage, depth, freshness, and usability. Scope coverage is the percentage of critical datasets, jobs, and consumption endpoints represented in the graph. Depth is the proportion of nodes with business terms, owners, and controls attached. Freshness is the percentage of nodes with lineage events within a defined window, enabled by event-based standards.⁵ Usability is a task-based measure such as “time to trace a KPI to its source with controls.” Standards and supervisory guides provide the reference characteristics and expectations that inform thresholds for “complete enough.”³ ⁴ ¹⁰ These metrics keep the programme honest and align improvements to audit and customer outcomes.
What did the 50-team benchmark reveal?
The benchmark surfaced four patterns. First, teams that instrument pipelines with an open lineage spec reach higher freshness and sustain it through change because emission rides with code and orchestration.⁵ ⁶ Second, teams that align business terms and control evidence to the lineage graph achieve faster audits and fewer escalations because they can answer “what changed, where, and why” in one view.² ³ ⁷ Third, leaders set explicit service levels for metadata and review them in the same operating rhythm as reliability metrics, which keeps lineage aligned with customer impact. Fourth, laggards concentrate effort in static documentation that quickly diverges from reality, which erodes trust and inflates the cost of change.
Next steps: what should executives sponsor in the next 90 days?
Executives should sponsor a focused, evidence-first sprint. Pick one revenue-critical or regulator-visible KPI. Define the in-scope datasets, jobs, and consumers. Instrument lineage emission using an open specification and route events to a central service.⁵ ⁶ Bind assets to business terms and attach control evidence aligned to your data management framework.⁷ Apply the four-measure scorecard and publish the results. Close the loop by baking lineage checks into change management, and report improvements in audit time saved and incident minutes avoided. Align the sprint to BCBS 239 expectations if you are in scope, and use ISO 8000 language to define quality characteristics that matter to your customers and supervisors.² ³ ⁴ ¹⁰
Evidentiary layer: what sources ground these practices?
Practices in this article build on three evidentiary anchors. First, supervisory guidance and assessments set expectations for traceability and completeness in risk data aggregation and reporting.² ³ Second, open specifications describe how to capture lineage as events and objects that tools can process consistently.⁵ ⁶ ⁹ Third, recognised data management bodies codify definitions and governance disciplines that make lineage comprehensible to business readers.⁷ ⁴ ¹⁰ These anchors help executives justify investment, align teams, and measure progress against standards that auditors recognise.
Call to action: make lineage usable, measurable, and defensible
Leaders win by making lineage complete enough to answer the real questions. They fund instrumentation at the point of change, define common terms, and attach control evidence to the graph. They measure completeness with a clear scorecard and review it alongside reliability. They anchor the programme to standards and supervisory guidance so that improvements stand up in audits and improve customer outcomes. The move from static documentation to event-rich, business-readable lineage is within reach. The organisations that act now will reduce risk, speed change, and build trust with customers and regulators.
FAQ
How do I define “lineage completeness” for regulatory reviews?
Define lineage completeness as the proportion of critical datasets, jobs, and consumption endpoints represented with accurate, current, and navigable lineage metadata. Align scope and characteristics to BCBS 239 expectations for accuracy, completeness, timeliness, and adaptability, and to ISO 8000 quality characteristics.² ³ ⁴ ¹⁰
What open standard should my engineering team adopt for lineage events?
Adopt an event-based specification such as OpenLineage, which models Jobs, Datasets, and run states and provides schemas and APIs for consistent capture across tools and orchestrators.⁵ ⁶ ⁹
Why does lineage matter for Customer Experience leaders?
Lineage reduces customer-impacting failures by tracing KPI breaks to their sources, accelerates incident response with runtime context, and prevents erroneous metrics from reaching decision systems. Event-based lineage keeps maps fresh, while governance frameworks keep them meaningful.⁴ ⁵ ⁷
Which governance framework should anchor business-readable lineage?
Use the DAMA-DMBOK framework to structure terms, ownership, and controls so non-technical stakeholders can understand and trust the lineage graph across CX, risk, and operations.⁷
How should we measure progress in ninety days?
Track four measures: scope coverage, depth of context, freshness of lineage events, and usability in task tests such as “time to trace a KPI to source with controls.” Use BCBS 239 and ISO 8000 language to set thresholds that auditors recognise.² ³ ⁴ ¹⁰
Who needs to sign off on lineage scope and controls?
Risk, audit, and CX stakeholders should sign off on the in-scope datasets and the minimal capture standard by tier. This cross-functional governance prevents gaps and ensures the graph supports both regulatory and customer outcomes.³ ⁷
Which approach reduces lock-in while improving completeness?
Combine a code-first lineage spec for capture with a catalog-first platform for governance and user experience. Instrument once, publish everywhere, and keep definitions aligned to enterprise frameworks.⁵ ⁷ ⁹
Sources
-
“Data Lineage – an overview.” Elsevier/ScienceDirect Topics, accessed 2025. https://www.sciencedirect.com/topics/computer-science/data-lineage
-
Basel Committee on Banking Supervision. Principles for effective risk data aggregation and risk reporting (BCBS 239). 2013. Bank for International Settlements. https://www.bis.org/publ/bcbs239.pdf
-
European Central Bank. Guide on effective risk data aggregation and risk reporting (RDARR). 2024. ECB Banking Supervision. https://www.bankingsupervision.europa.eu/ecb/pub/pdf/ssm.supervisory_guides240503_riskreporting.en.pdf
-
ISO. ISO 8000-1:2022 Data quality — Part 1: Overview. 2022. International Organization for Standardization. https://www.iso.org/standard/81745.html
-
OpenLineage. About OpenLineage. 2025. OpenLineage Project. https://openlineage.io/docs/
-
OpenLineage. OpenLineage API Docs. 2024. OpenLineage Project. https://openlineage.io/apidocs/openapi/
-
DAMA International. DAMA-DMBOK: Data Management Body of Knowledge. 2017 edition. DAMA International. https://dama.org/learning-resources/dama-data-management-body-of-knowledge-dmbok/
-
PwC Australia. BCBS 239: Principles for effective risk data aggregation and reporting. 2019. PwC. https://www.pwc.com.au/financial-services/pdf/principles-for-effective-risk-data-aggregation-sept19.pdf
-
OpenLineage. Object Model. 2025. OpenLineage Project. https://openlineage.io/docs/spec/object-model/
-
ISO. ISO 8000-1 Overview (Online Browsing Platform extract). 2024. International Organization for Standardization. https://www.iso.org/obp/ui/es/