


What is a data quality pipeline and why should leaders care?
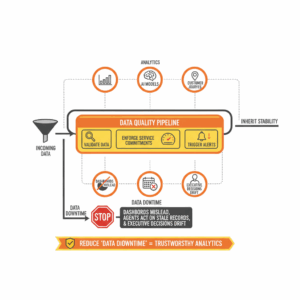
Leaders treat the data quality pipeline as the control system for trustworthy analytics. This unit validates incoming data, enforces service commitments, and triggers alerts before defects reach customers or executives. A data quality pipeline applies explicit checks to data at rest and in motion, measures service behavior against agreed targets, and routes notifications to people who can fix issues quickly. When this structure works, downstream analytics, AI models, and customer journeys inherit stability. When it fails, dashboards mislead, agents act on stale records, and executive decisions drift. Teams that define checks, establish service level objectives, and instrument actionable alerts reduce “data downtime,” the period when data is missing, stale, or wrong.¹
How do data quality checks actually work?
Teams implement data quality checks as verifiable assertions about datasets and their behavior. A check asserts a rule such as “column X must be unique” or “table Y must have at least N rows today.” Modern validation frameworks represent these rules as reusable “expectations,” run them on a schedule, and produce human readable reports. Great Expectations popularized the pattern of Expectations, Validation Results, and Data Docs, which turn test outcomes into browsable documentation and trigger actions such as notifications or ticket creation.² ³ Checks can evaluate schema conformance, null rates, value ranges, distribution drift, and referential integrity. Effective programs layer checks at ingestion, transformation, and serving, and then couple them to lineage so failures show both impact and root cause. Open standards for lineage allow systems to emit events about runs, jobs, and datasets, which enables failure blast radius analysis.⁴ ⁵
Which checks matter most in a first release?
Teams start with a small, high signal set of checks that match business risk. Leaders favor five categories. Freshness checks ensure a table updates within a set interval, which protects time sensitive analytics. Volume checks verify row counts and detect drop offs or spikes. Schema checks confirm that column additions, removals, or type changes are intentional. Distribution checks watch statistics like mean, distinct counts, or quantiles. Integrity checks enforce uniqueness and non null constraints on primary keys and foreign keys. Data observability platforms provide opinionated defaults in these categories and wire them into alerting so the team is not hand coding every monitor.⁶ ⁷
What are SLIs, SLOs, and SLAs in data pipelines?
Executives anchor reliability work in three related terms. A Service Level Indicator, or SLI, is the direct measurement of a customer relevant property such as data freshness or successful pipeline runs. A Service Level Objective, or SLO, is the target for that indicator, such as “freshness under 60 minutes for 99.5 percent of hours.” A Service Level Agreement, or SLA, is an external commitment that may include remedies if the service misses targets. The SRE literature defines these terms precisely and recommends designing SLOs that reflect user experience rather than internal component metrics.⁸ ⁹ ¹⁰ This structure clarifies intent, guides alerting, and allows leaders to trade delivery velocity against error budgets without guesswork.⁹
How do you convert quality checks into SLOs that drive action?
Teams convert checks into SLOs by choosing SLIs that approximate real consumer experience. If analysts need a daily sales table by 06:00, the SLI is the time the table becomes queryable. The SLO could be “table available by 06:00 for 29 of 30 days,” which equates to a monthly 96.7 percent objective. If a pipeline has multiple dependencies, lineage helps identify which upstream job threatens the objective most often, enabling targeted investments. Data observability tools offer SLI templates for freshness and volume, and they expose configuration surfaces where teams set thresholds and recipients.¹¹ ⁶ Leaders then codify SLAs for critical consumers, such as contact center reporting or regulatory extracts, to create shared expectations.
How should teams design alerts that reduce noise and speed recovery?
Teams design alerts that respect on call attention. Good alerts map to SLO breaches or to failures that will cause an SLO breach soon. The Google SRE workbook advises alerting on customer impacting symptoms and using multi window multi burn rate logic so teams respond to fast burns and slow burns without fatigue.¹² Alert channels should match severity. High urgency issues trigger pager notifications. Medium urgency issues create tickets with a clear due time. Low urgency signals go to daily digests. Orchestrators such as Apache Airflow expose task and DAG callbacks that fire on failure or success, which lets engineers attach notifiers that send emails, Slack messages, or create incidents automatically.¹³ ¹⁴ Cloud managed Airflow distributions add opinionated notification patterns and guidance on alert hierarchies across task, DAG, and environment scopes.¹⁵
How do lineage and orchestration improve triage?
Leaders connect validation, lineage, and orchestration to accelerate diagnosis. When a check fails, the alert should include the failing dataset, the last successful run, and the set of downstream dashboards and models. OpenLineage defines a common object model for datasets, jobs, runs, and their relationships, which allows orchestration systems to emit standardized events.⁴ ¹⁶ With this metadata, an on call engineer can answer three questions quickly. What broke. Who depends on it now. Where should I apply a fix. The inclusion of run states and job context also supports auto rollback or auto quarantine patterns for corrupted partitions, reducing the chance of propagating defects.
How do you measure success for a data quality program?
Executives measure success with a mix of outcome metrics and program health indicators. Outcome metrics include data downtime hours avoided, SLO attainment rate by tier, and mean time to detect and resolve quality incidents. Program health measures include coverage of checks across tier one datasets, lineage completeness, and alert fidelity measured as the ratio of actionable alerts to total alerts. Data observability case studies report material reductions in unresolved incidents once schema change alerts and freshness monitors are active, which aligns with the intuition that early detection limits blast radius.⁷ Teams publish these metrics in a reliability dashboard that is reviewed monthly alongside delivery goals.
What is a pragmatic operating model for checks, SLOs, and alerts?
Organizations adopt a tiered operating model. The data platform team owns shared frameworks for validation, lineage capture, and alerting. Domain teams own checks and SLOs on their products and publish SLAs to their consumers. A change management process requires that any breaking schema change includes a migration plan and a temporary alert suppression window. Code reviews include validation additions when a new dataset joins a tier one flow. Orchestration enforces pre deployment checks that run a subset of validations in staging. Documentation remains part of the deliverable. Validation reports and SLO pages live next to model or dashboard code as Data Docs or equivalent artifacts.²
How do you start in 30 days without boiling the ocean?
Leaders start with a tight, high value scope. Week one selects three tier one datasets that support executive or customer decisions. Week two implements five checks per dataset and turns on freshness and volume SLIs. Week three wires alerts through the orchestrator and writes a one page SLO per dataset with a simple error budget. Week four connects lineage for those flows and publishes the reliability dashboard. Data observability platforms can accelerate this path with baked monitors, templated SLIs, and alerting integrations.⁶ ¹¹ This tempo establishes muscle memory, proves value to stakeholders, and creates a repeatable pattern for the next tranche of datasets.
Which pitfalls should teams avoid as the system matures?
Teams avoid three common pitfalls. The first pitfall is over alerting on low value checks that do not threaten SLOs, which leads to fatigue and missed incidents. The second pitfall is static thresholds that do not evolve with seasonality or growth. The third pitfall is missing lineage, which converts every incident into a slow, manual triage. Leaders counter these risks by revisiting SLOs quarterly, pruning noisy alerts, and expanding lineage visibility as new tools enter the stack. The SRE guidance encourages periodic SLO calibration and thoughtful alert design to keep attention where it matters most.¹² ⁹
How does this apply to Customer Experience and Service Transformation?
Customer leaders tie pipeline reliability to frontline outcomes. A daily contact center performance view must reflect every overnight load. A churn propensity model must score on current interactions, not last week’s traffic. When checks enforce freshness and integrity and when SLOs reflect business deadlines, service teams act on data with confidence. Reliable pipelines reduce escalations caused by incorrect metrics and shorten the cycle time to adjust staffing, offers, or journeys. Platforms that integrate validation, lineage, and alerting create a transparent reliability contract between data producers and CX consumers, which builds trust at scale.⁶ ⁴
Next steps leaders can take this quarter
Executives can adopt a simple plan. Define SLIs and SLOs for the top five CX datasets and publish one page SLAs to consumers. Instrument five checks per dataset and enable lineage capture across the critical paths. Configure alerts that map directly to SLO burn rates and send them to responders with playbooks attached. Review error budgets in monthly governance and redirect investment to the biggest sources of burn. Follow the SRE workbook’s approach to alerting and incident response to maintain discipline as scope grows.¹² ⁶ This cadence builds a culture that treats data reliability as a first class capability, equal to delivery speed and cost.
FAQ
What is the difference between a data SLI, SLO, and SLA in pipelines?
A Service Level Indicator measures a property such as freshness or successful runs. A Service Level Objective sets a target for that measurement, such as freshness under 60 minutes for 99.5 percent of hours. A Service Level Agreement is an external commitment that may include remedies if targets are missed.⁸ ⁹ ¹⁰
How do Great Expectations style checks help Customer Science programs?
Great Expectations formalizes checks as Expectations, produces Validation Results, and generates Data Docs for transparent reporting. This pattern lets CX leaders standardize rules, trigger actions, and keep documentation current without bespoke code.² ³
Which checks should contact center analytics teams implement first?
Teams should start with freshness, volume, schema, distribution, and integrity checks on tier one datasets that power daily staffing, performance dashboards, and customer journey analytics. Data observability platforms offer templates for these categories.⁶ ¹¹
Why connect data quality with lineage such as OpenLineage?
Lineage expresses relationships among jobs, runs, and datasets. When a check fails, lineage identifies downstream dashboards and models and accelerates root cause analysis. OpenLineage provides an open specification and API for emitting standardized lineage events.⁴ ¹⁶
Which alerting patterns reduce noise in orchestration tools like Airflow?
Teams should alert on SLO symptoms rather than every failure, use multi window burn rate policies, and route high urgency incidents to pager channels. Airflow provides task and DAG callbacks and notifier hooks to integrate email, Slack, or incident systems.¹² ¹³ ¹⁴ ¹⁵
How do SLAs for data pipelines improve trust with internal consumers?
SLAs communicate clear deadlines and quality targets for datasets that power CX and analytics. When combined with SLIs and SLOs, SLAs set shared expectations and provide a basis for governance and escalation.¹¹
Which metrics prove that the data quality program works?
Leaders track data downtime hours avoided, SLO attainment, mean time to detect and resolve incidents, check coverage for tier one datasets, lineage completeness, and alert fidelity ratios. Case studies show reductions in incident impact once freshness, schema, and volume monitors are active.⁷
Sources
“What Is Data Observability? 5 Key Pillars To Know In 2025.” Monte Carlo, 2025, blog. https://www.montecarlodata.com/blog-what-is-data-observability/
“Validate Data.” Great Expectations Documentation, 2024, docs. https://docs.greatexpectations.io/docs/0.18/oss/guides/validation/validate_data_lp/
“Data Docs.” Great Expectations Documentation, 2024, docs. https://docs.greatexpectations.io/docs/0.18/reference/learn/terms/data_docs/
“About OpenLineage.” OpenLineage Documentation, 2025, docs. https://openlineage.io/docs/
“OpenLineage API Docs.” OpenLineage, 2025, API reference. https://openlineage.io/apidocs/openapi/
“How To Meet Your Data Reliability OKRs With SLIs.” Monte Carlo, 2021, blog. https://www.montecarlodata.com/blog-how-to-meet-your-data-reliability-okrs-with-monte-carlos-service-level-indicators-slis/
“61 Data Observability Use Cases From Real Data Teams.” Monte Carlo, 2023, blog. https://www.montecarlodata.com/blog-data-observability-use-cases/
“Defining SLOs.” Google SRE Book, 2016, book chapter. https://sre.google/sre-book/service-level-objectives/
“Implementing SLOs.” Google SRE Workbook, 2019, book chapter. https://sre.google/workbook/implementing-slos/
“SRE fundamentals: SLAs vs SLOs vs SLIs.” Google Cloud Blog, 2018, blog. https://cloud.google.com/blog/products/devops-sre/sre-fundamentals-slis-slas-and-slos
“Why You Need To Set SLAs For Your Data Pipelines.” Monte Carlo, 2021, blog. https://www.montecarlodata.com/blog-how-to-make-your-data-pipelines-more-reliable-with-slas/
“Alerting on SLOs.” Google SRE Workbook, 2019, book chapter. https://sre.google/workbook/alerting-on-slos/
“Callbacks.” Apache Airflow Documentation, 2025, docs. https://airflow.apache.org/docs/apache-airflow/stable/administration-and-deployment/logging-monitoring/callbacks.html
“Tasks.” Apache Airflow Documentation, 2025, docs. https://airflow.apache.org/docs/apache-airflow/stable/core-concepts/tasks.html
“Apache Airflow hierarchy and alerting options with Cloud Composer.” Google Cloud Blog, 2024, blog. https://cloud.google.com/blog/products/data-analytics/apache-airflow-hierarchy-and-alerting-options-with-cloud-composer