


What problem does a digitisation prioritisation framework actually solve?
Executives face more worthy digitisation ideas than budget or delivery capacity. Operations feel the pain of legacy forms and manual steps while customers still phone to “just check.” A prioritisation framework answers one question: which services should we digitise first to maximise value, reduce risk, and show results fast. Strong programs link journey outcomes to economics so leaders can defend the sequence. McKinsey’s work shows decisions accelerate when experience improvements are tied explicitly to revenue, retention, and cost.¹ In service contexts, reducing customer effort prevents disloyalty more reliably than delight, so the framework must reward friction removal, not novelty.²
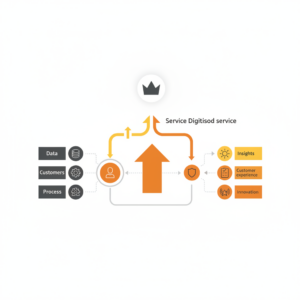
What is “service digitisation” in practical terms?
Service digitisation means redesigning a service so customers can complete jobs online end to end, with clear status and clean escalation when needed. ISO 9241-210 defines human-centred design principles that keep solutions usable and useful across the lifecycle.³ ISO 18295 expects accurate, current information for consistent outcomes in contact centres, which makes knowledge and guidance part of digitisation, not an afterthought.⁴ Event-triggered communication updates customers when a real state changes and stops after completion, reducing avoidable “just checking” contacts.⁵ These principles keep digitisation honest and measurable.
How should we prioritise services for digitisation?
Use a five-factor score that balances value, feasibility, risk, readiness, and equity. Score 1–5 for each, then rank by weighted total.
-
Customer value. Volume, pain, and effort. Use evidence from contact reasons, complaints, abandonment, and repeat-within-seven-days. Research links lower effort to better loyalty and lower recontact.²
-
Economic value. Cost per resolved case today, cycle-time impact, and expected reduction in assisted demand. McKinsey recommends an explicit value tree that maps journey metrics to the P&L.¹
-
Feasibility. Rule clarity, data quality, and integration complexity. ISO 9241-210 urges teams to consider context-of-use and constraints early to avoid rework.³
-
Risk and compliance. Privacy, payments, and policy obligations. Align flows with the Australian Privacy Principles for informed, specific, current, and voluntary consent and purpose limitation.⁶
-
Equity and access. Inclusion for vulnerable customers and low-friction assisted alternatives. This protects uptake and prevents failure demand from hard-to-serve cohorts. Government digital guidance consistently emphasises inclusive access as a design constraint, not an add-on.⁷
Weighting usually starts at 30 percent economic value, 25 percent customer value, 20 percent feasibility, 15 percent risk, and 10 percent equity. Adjust weights to strategy.
What evidence do we need before we score?
Collect three datasets and one design artefact. First, demand and performance: traffic, abandonments, FCR, repeats, and cost per resolved contact by intent. ICMI’s FCR definition provides a crisp lagging proof that a job was resolved first time.⁸ Second, failure demand: the share of contacts that check status or fix prior errors. Third, policy and system constraints: identity, entitlements, and integration points. Finally, produce a service blueprint so backstage rules and dependencies are visible. Blueprinting converts design into operational change.⁹
What makes a service a “good first target”?
Good targets have high frequency, clear rules, and verifiable completion states. Examples include proof-of-address updates, appointment management, refund requests, and plan changes. These services benefit from structured capture, eligibility checks, and event-driven status updates. Event-triggered orchestration with hold-until prevents post-completion nudges that trigger avoidable contacts.⁵ Pair each candidate with a one-page business case that shows low, base, and high benefits with confidence factors; Forrester’s TEI method is the clean way to price uncertainty.¹⁰
How do we size benefits credibly without overpromising?
Express benefits along four lines with ranges.
-
Shift to digital completion: tasks completed online × assisted unit cost avoided.
-
FCR lift: fewer repeats × unit contact cost.
-
Cycle-time gains: faster resolution × revenue, cash flow, or working-capital impact.
-
Error and complaint reduction: reduction in rework × rework cost and complaint handling.
TEI recommends presenting low, base, and high cases with adoption curves and confidence factors, which boards recognise as responsible forecasting.¹⁰
What minimal architecture lets us deliver quickly?
Start with a digital front door that supports authenticated and guest flows, a rules and orchestration layer that evaluates eligibility and triggers next steps, and a status service that publishes events and suppresses messages after completion. Add knowledge and guidance so resolvers use consistent steps. ISO 18295 expects accuracy and currency for front line staff, which must mirror customer guidance.⁴ Add retrieval-augmented assistance for agents to draft answers with citations from approved sources. RAG reduces hallucination risk and speeds the first useful step.¹¹
How do privacy and risk shape the prioritisation and build?
Bake privacy into scoring and delivery. The Australian Privacy Principles require consent and purpose checks at collection and at use, plus rights to access and correction.⁶ Instrument consent as metadata that travels with context and redact personal information before prompts or generation. For payments, keep PAN out of transcripts and recordings using PCI DSS-compliant capture such as DTMF masking or out-of-band flows.⁵ These controls convert policy into code and speed approvals.
How do we measure progress week by week and quarter by quarter?
Use a paired scorecard per service. Leading signals: time to first useful step, form completion rate, grounded-answer rate for assisted flows, and event-delivery success. Lagging outcomes: digital completion rate, FCR after handoff, repeat-within-seven-days, and cost per resolved contact. HEART’s goal–signal–metric discipline keeps numbers tied to decisions rather than dashboards.¹² Publish one change log and one outcome log each sprint so stakeholders see mechanism and outcome together.
What 90-day delivery pattern proves the framework works?
Days 1–30: Decide and baseline.
Score the top ten services using the five-factor model. Select two to three for Wave 1. Map current and next state with a service blueprint. Establish baselines for completion, FCR, repeats, and cost per resolved contact.⁸ ⁹
Days 31–60: Design and thin-slice.
Rewrite content to be task-first and scannable. NN/g shows users scan and succeed more with front-loaded guidance.¹³ Build a thin slice: authenticated capture, eligibility check, and event-driven status with hold-until.⁵ Add assisted fallback with warm handoff and desktop guidance matching the same steps.⁴
Days 61–90: Prove and harden.
Release to a cohort. Track leading signals in week and lagging outcomes by day 90. Refresh TEI ranges with observed deltas and confidence factors. Scale only when completion rises and repeats fall for exposed cohorts.¹⁰
What failure modes should we anticipate and how do we avoid them?
Feature-first roadmaps ignore economics. Fix with value trees and TEI ranges per service.¹ ¹⁰ Opaque status creates avoidable contacts. Fix with event-driven updates that stop after completion.⁵ Verbose guidance drives abandonment. Fix with task-first content and consistent desktop guidance.¹³ ⁴ Ungrounded AI drafts fluent errors. Fix with RAG and citations that fail closed when sources are missing.¹¹ Equity blind spots exclude cohorts. Fix with inclusive design and assisted alternatives baked into the prioritisation score.⁷
What outcomes should executives expect within two quarters?
Expect earlier movement in time to first useful step and form completion within weeks as clarity improves. Expect measurable increases in digital completion and FCR with fewer repeats for targeted services in one to two cycles.⁸ Expect lower “just checking” contacts where status becomes event-driven.⁵ Expect conservative yet confident value reporting because the TEI ranges incorporate observed deltas and adoption.¹⁰ These signals indicate that digitisation is reducing effort and converting that relief into economic gain.
FAQ
What makes a service a top priority for digitisation?
High volume, high friction, clear rules, and a verifiable completion state. Score candidates on customer value, economic value, feasibility, risk, and equity, then fund top scorers first.¹ ²
How do we prove digitisation cut demand on assisted channels?
Track digital completion, First Contact Resolution after handoff, and repeat-within-seven-days for the same issue. Use matched cohorts. ICMI’s FCR definition gives you an auditable lagging proof.⁸
Why use event-triggered status instead of scheduled emails?
Event-triggered updates fire on real state changes and hold or stop when completion occurs, which reduces avoidable “just checking” contacts.⁵
How do we avoid overpromising benefits?
Use Forrester’s TEI method with low, base, and high scenarios, adoption curves, and confidence factors. Refresh ranges with observed deltas after pilots.¹⁰
Where does AI safely help digitisation?
Use retrieval-augmented assistance to draft grounded answers with citations for agents and knowledge authors. RAG reduces hallucination risk and speeds correct work.¹¹
Which standards should govern design and operations?
ISO 9241-210 for human-centred design and ISO 18295 for accurate, current information and consistent outcomes in contact centres.³ ⁴
What weekly metrics should leaders review?
Time to first useful step, form completion, event-delivery success, digital completion, FCR after handoff, and repeat-within-seven-days. HEART keeps each tied to a decision.¹²
Sources
-
Linking the Customer Experience to Value — Joel Maynes; Alex Rawson; Ewan Duncan; Kevin Neher, 2018, McKinsey & Company. https://www.mckinsey.com/capabilities/growth-marketing-and-sales/our-insights/linking-the-customer-experience-to-value
-
Stop Trying to Delight Your Customers — Matthew Dixon; Karen Freeman; Nicholas Toman, 2010, Harvard Business Review. https://hbr.org/2010/07/stop-trying-to-delight-your-customers
-
ISO 9241-210:2019 — Human-centred design for interactive systems — International Organization for Standardization, 2019, ISO. https://www.iso.org/standard/77520.html
-
ISO 18295 — Customer Contact Centres (Parts 1 & 2) — International Organization for Standardization, 2017, ISO. https://www.iso.org/standard/63167.html
-
Event-Triggered Journeys: Hold-Until and Experiments — Twilio, 2024, Product documentation. https://www.twilio.com/docs/segment/engage/journeys/v2/event-triggered-journeys-steps
-
Australian Privacy Principles — Office of the Australian Information Commissioner, 2023, OAIC. https://www.oaic.gov.au/privacy/australian-privacy-principles
-
Service Standard — Government Digital Service (UK), 2023, gov.uk. https://www.gov.uk/service-standard
-
First Contact Resolution: Definition and Approach — ICMI, 2008, ICMI Resource. https://www.icmi.com/files/ICMI/members/ccmr/ccmr2008/ccmr03/SI00026.pdf
-
Service Blueprinting: A Practical Technique for Service Innovation — Mary Jo Bitner; Amy L. Ostrom; Felicia N. Morgan, 2008, California Management Review. https://cmr.berkeley.edu/2008/12/service-blueprinting/
-
Total Economic Impact (TEI) Methodology — Forrester, 2020–2025, Forrester Research. https://www.forrester.com/teI/methodology
-
Retrieval-Augmented Generation for Knowledge-Intensive NLP — Patrick Lewis; Ethan Perez; Aleksandra Piktus; et al., 2020, NeurIPS. https://proceedings.neurips.cc/paper_files/paper/2020/hash/6b493230205f780e1bc26945df7481e5-Abstract.html
-
Measuring the User Experience at Scale (HEART Framework) — Kerry Rodden; Hilary Hutchinson; Xin Fu, 2010, Google Research Note. https://research.google/pubs/pub36299/