


What is a journey map audit and why does it matter?
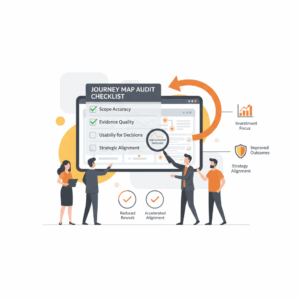
Leaders treat a journey map audit as a structured quality check that verifies whether current maps reflect real customer behavior and current operational reality. The audit tests four things: scope accuracy, evidence quality, usability for decisions, and alignment to strategy. When a map meets these standards, teams reduce rework, accelerate cross functional alignment, and focus investment on the highest value pain points. Expert sources frame journey mapping as a research grounded artifact that connects customer insights to service design and delivery, not as a poster on the wall.¹ The audit ensures your organization uses journey maps as living instruments that improve outcomes rather than static illustrations that age in place.²
How should you prepare an inventory and define scope?
Teams start by inventorying every map that exists across the enterprise. Capture owner, creation date, research method, personas, stages, touchpoints, channels, data sources, and linked KPIs. Create a simple register so leaders can see duplication, gaps, and outdated assets at a glance. Good practice treats each map as a versioned document with a clear purpose such as discovery, alignment, blueprinting, or measurement.³ Define the audit scope next. Decide which journeys are in play, which personas are in focus, and which lifecycle moments create the most value risk. This preparation prevents endless debate during review sessions and keeps the audit anchored to the organization’s strategy.⁴
What criteria prove a map is decision ready?
Auditors score every map against five decision ready criteria: customer truth, operational truth, clarity, traceability, and portability. Customer truth checks that the map reflects direct research such as interviews, diary studies, or field observation rather than assumptions.¹ Operational truth checks that backstage processes, policies, and systems are explicit using service blueprint elements.² Clarity checks readability, consistent stage definitions, and visual hierarchy that supports quick scanning.³ Traceability checks that every insight links back to a source and every recommendation links forward to an owner and a metric.⁵ Portability checks that teams can reuse the artifact in roadmaps, training, and governance without rework.⁶
How do you verify customer truth and evidence quality?
Review the research trail behind each map. Confirm the sample covers the right personas and channels. Look for method triangulation that blends qualitative insight with behavioral or operational data. Leading practitioners recommend pairing journey mapping with contextual inquiry, analytics, and diary studies to expose temporal, emotional, and environmental factors that standard surveys miss.¹ Experts also recommend mapping the service ecology around the customer, including front stage and backstage interactions, to avoid shallow fixes.² Evidence quality improves when researchers publish a short protocol, a coding plan, and verbatim excerpts that anchor key moments such as triggers, handovers, and resolutions.³
How do you check operational truth with service blueprinting?
Auditors extend each journey map with a thin service blueprint that documents support processes, people, and technology for each step. A blueprint reveals failure points such as queue backlogs, policy constraints, and system handoffs that create customer friction. Service blueprinting also clarifies ownership across swimlanes by showing who does what and when.² Teams that practice human centered design tie blueprint checks to explicit usability and accessibility principles to ensure the backstage supports inclusive experiences.⁷ A simple checklists works. For each step ask whether the backstage has a defined owner, a measurable SLA, an accessible design standard, and an error recovery path. If any answer is no, flag a risk.
How should teams validate with metrics without flattening nuance?
Treat metrics as evidence, not as the whole story. Link journey stages to a small set of consistent KPIs such as resolution time, abandonment rate, first contact resolution, satisfaction, and NPS. Connect each KPI to an operational definition and a data owner so analysts can reproduce results.⁸ Apply the HEART framework for digital journeys when appropriate to track Happiness, Engagement, Adoption, Retention, and Task success.⁹ Use the Kano model to separate must haves from delighters so teams do not over invest in features that only reduce dissatisfaction.¹⁰ Close the loop by tying any metric movement to a hypothesis and a next action so leaders can see progress.
What workshop format gets cross functional alignment fast?
Run a two hour audit workshop for each high value journey. Invite the journey owner, frontline leaders, design research, product, engineering, risk, and compliance. Set ground rules that protect customer voice and operational reality. Use timeboxed rounds. Round one scores the map against the five criteria. Round two annotates the map with evidence links and operational defects. Round three converts defects into opportunity statements shaped as outcome hypotheses. Leading teams facilitate with a visible canvas and dot voting to converge quickly.³ Government service teams publish facilitation patterns that help groups move from insight to testable changes in a single session.⁴
Which prioritization method converts findings into an investment roadmap?
Translate opportunity statements into a sequenced roadmap using an explicit model. The RICE method scores Reach, Impact, Confidence, and Effort to rank work for product and digital change.¹¹ The Cost of Delay method expresses time sensitivity by combining business value with urgency. The Double Diamond model helps teams separate discovery and delivery so research and prototyping do not vanish when delivery pressure rises.⁷ At the portfolio level, leaders should maintain a living backlog of journey improvements with owners, hypotheses, and measures. This backlog becomes the single source of truth for investment choices and lets finance and technology track value realization over time.¹²
How do you embed governance so maps stay alive?
Organizations embed journey governance by assigning named owners, update cadences, and entry criteria for changes. Owners agree to refresh customer evidence at set intervals and to trigger an update when events such as policy shifts or channel launches occur. Good governance also mandates accessibility and usability standards for the artifact, including plain language and alt text for visual maps.⁷ Publishing maps in an internal library with version control and lightweight templates reduces copy and paste errors and makes it easy to find the latest truth. NN Group recommends pairing journey maps with service blueprints and with curated annotations that explain decisions to future teams.¹
What risks should leaders watch and how can teams mitigate them?
Leaders watch for four common risks. Teams sometimes confuse an aspirational map with a current state picture, which hides gaps. Auditors label each artifact clearly as current, future, or experimental to avoid confusion. Teams sometimes treat emotion curves as data rather than signals. Researchers correct this by linking emotion points to coded evidence and observable behavior. Analysts sometimes optimize a single KPI at the expense of another. Balanced scorecards for journeys prevent metric monoculture.⁸ Finally, organizations sometimes over rotate to workshops without field research. Leaders fix this by funding regular customer contact and by publishing research protocols alongside maps.¹
How should you measure audit impact and prove value to the business?
Leaders demonstrate value by linking audit findings to faster cycle times, higher first contact resolution, improved adoption, and lower cost to serve. Define a baseline before remediation, then track time to decision, time to deliver, defect removal efficiency, and customer outcome movement over a quarter.⁹ Publish a short monthly report that shows which maps were updated, which hypotheses were tested, which metrics moved, and which learnings will change the next sprint. Use a simple logic chain that shows how audit discipline improves map quality, how map quality improves prioritization, and how prioritization improves customer and financial outcomes.¹²
What are the next steps to run your audit in 30 days?
Executives commit to a 30 day plan that proves momentum. Week one builds the inventory and selects the top three journeys by value risk. Week two completes evidence checks and service blueprint extensions. Week three runs alignment workshops and applies RICE scoring. Week four publishes the prioritized roadmap, assigns owners, and schedules governance cadences. Publish the artifact library to an internal portal and socialize the new standards. Close the month by telling a clear story about customer truth, operational truth, and measurable outcomes. This cadence builds confidence, reduces noise, and turns journey mapping into a repeatable management system.³
FAQ
What is a journey map audit in Customer Experience and Service Transformation?
A journey map audit is a structured review that validates customer truth, operational truth, clarity, traceability, and portability so maps become decision ready assets that guide investment and delivery.¹
How do Contact Centre leaders use service blueprinting in the audit?
Contact Centre leaders extend journey maps with backstage processes, people, and systems to reveal ownership, SLAs, and failure points that drive resolution and experience outcomes.²
Which metrics should enterprise CX executives link to journey stages?
Executives link stages to a small set of consistent metrics such as resolution time, abandonment, first contact resolution, satisfaction, NPS, and digital HEART measures for task success and retention.⁸ ⁹
Why pair qualitative research with analytics during journey validation?
Teams pair interviews, observation, and diary studies with behavioral and operational data to triangulate evidence and reduce bias, which improves the reliability of journey insights and decisions.¹
Which prioritization method works best for roadmap decisions after the audit?
RICE works well for product and digital improvements because it balances reach, impact, confidence, and effort in a simple score that drives transparent ranking.¹¹
Who should attend a cross functional audit workshop?
Invite the journey owner, frontline leaders, design research, product, engineering, risk, and compliance so customer voice and operational reality are represented and decisions can stick.³ ⁴
What governance keeps journey maps accurate over time?
Assign named owners, update cadences, accessibility standards, and a shared library with version control so teams can find and trust the latest artifact across the enterprise.⁷
Sources
Nielsen Norman Group — Journey Mapping 101: Definition, Benefits, and Types — Kate Kaplan — 2017 — NN/g. https://www.nngroup.com/articles/journey-mapping-101/
Service Blueprinting: A Practical Technique for Service Innovation — Mary Jo Bitner, Amy L. Ostrom, Felicia N. Morgan — 2008 — California Management Review. https://cmr.berkeley.edu/2008/12/service-blueprinting/
This Is Service Design Doing: Applying Service Design Thinking in the Real World — Marc Stickdorn, Markus Edgar Hormess, Adam Lawrence, Jakob Schneider — 2018 — O’Reilly Media. https://www.thisisservicedesigndoing.com/
GOV.UK Service Manual — Map the end to end service — Government Digital Service — 2023 — GOV.UK. https://www.gov.uk/service-manual/design/map-the-end-to-end-service
Research Repositories and Traceability in UX — Alita Joyce — 2020 — NN/g. https://www.nngroup.com/articles/research-repositories/
Journey Mapping Best Practices for Enterprise Portability — Sarah Gibbons — 2018 — NN/g. https://www.nngroup.com/articles/journey-map-ux/
ISO 9241 210:2019 — Human Centred Design for Interactive Systems — International Organization for Standardization — 2019 — ISO. https://www.iso.org/standard/77520.html
Net Promoter System Overview — Fred Reichheld, Bain & Company — 2022 — Bain & Company. https://www.netpromotersystem.com/
Evaluating Interactive Systems with the HEART Framework — Kerry Rodden, Hilary Hutchinson, Xin Fu — 2010 — Google Research. https://research.google/pubs/heart-framework/
Attractive Quality and Must Be Quality — Noriaki Kano — 1984 — Journal of the Japanese Society for Quality Control (overview at NN/g). https://www.nngroup.com/articles/kano-model/
Intercom Product Management — RICE: Simple prioritization for product teams — Sean McBride — 2017 — Intercom Blog. https://www.intercom.com/blog/rice-simple-prioritization-for-product-managers/
OECD — Linking Outputs and Outcomes for Performance Budgeting — OECD — 2019 — OECD Library. https://www.oecd-ilibrary.org/governance/linking-outputs-and-outcomes-for-performance-budgeting_1de9c7bb-en