


Why does cross-channel journey mapping matter right now?
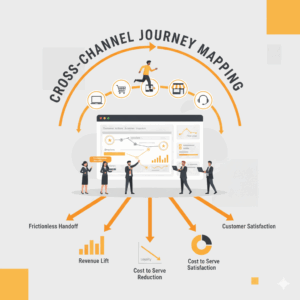
Executives face customers who move across channels with high intent and low patience. Research shows that organizations that manage end-to-end journeys, rather than disconnected touchpoints, lift customer satisfaction and revenue while lowering cost to serve.¹ Omnichannel customers also spend more, use digital tools before and after store visits, and show stronger loyalty than single-channel shoppers.² Leaders therefore treat journey mapping as an operating system for decisions, not a poster on a wall. The playbook below translates this stance into actions your teams can run within enterprise governance. It aligns Customer Experience, Service Transformation, and Contact Centre operations around the same evidence. It keeps language simple and outcomes measurable. It favors fast iteration over theatrical workshops. The goal is clarity. The outcome is coordinated change that customers can feel and finance leaders can verify.¹ ²
What is cross-channel journey mapping?
Cross-channel journey mapping creates a visual, evidence-based narrative of how a customer or user persona achieves a goal across channels and time. A robust map combines stages, customer actions, thoughts, and feelings with frontstage touchpoints and backstage systems that enable each step.³ Public sector guidance frames an experience map as a concise artifact that shows stages, key findings, images, and quotes so that any stakeholder can read it without hand-holding.⁴ In practice, your team should produce a single source of truth that explains the customer’s goal, the entry points, the switching between channels, and the exit conditions. The map clarifies ownership across marketing, digital, contact centres, branches, and field operations. It is not a journey fantasy. It is a research-anchored view that your organization can test and improve in market.³ ⁴
Where should you start to avoid pretty maps with no impact?
Leaders start with journeys that concentrate value. Many organizations create journey maps yet underuse them. A Gartner review notes that while the majority of enterprises have built journey maps, fewer than half use them effectively. These teams struggle because maps are not tied to decisions, metrics, and funding.⁵ Start with one of three value-dense journeys: onboarding for new customers, service recovery after a failure, or renewal and expansion. Each concentrates measurable outcomes such as first-time resolution, activation, containment, retention, and cross-sell. Define a crystal-clear problem statement and the decision that the map will inform, such as which failure demand to eliminate or which digital deflection to scale. Link the map to governance and an owner who controls a budget.
How do you gather the right evidence fast?
Teams collect triage-level evidence before deep dives. Combine three inputs. First, use existing operational and interaction analytics to identify high-volume intents, handoffs, and repeat contacts. Second, run qualitative research to capture thinking, saying, doing, and feeling for each stage. Leading UX sources classify journey mapping as a method within the broader discovery and listen toolkit that includes interviews, support call reviews, and diary studies.⁶ Third, sample cross-channel friction by “walking the path” with test accounts through digital, voice, and assisted channels. Treat each insight as a hypothesis you can verify with additional data as needed. Codify evidence in a structured template with fields for persona, scenario, expectations, pain points, backstage blockers, and opportunities.³ This keeps facts stable and the story legible to executives who decide where to invest.³ ⁶
What does a high-signal workshop look like?
Teams run a two-hour, high-signal session that converts evidence into a shared map. Start with the customer’s goal in a single sentence. Place the primary stages from entry to exit. Add real quotes and artifacts to ground each stage. Mark emotions and friction with simple scoring to avoid theatrics. Map frontstage channels and backstage enablers such as identity, knowledge, policy, and platforms. Identify handoffs that create unnecessary effort for customers or agents. Use a visible rule for prioritization, such as impact on volume times ease of change. End with three target opportunities, each with a defined owner and a next action. Publish the draft within your knowledge system and open comments for seven days. Treat the workshop as a decision accelerator, not a requirement-gathering marathon. The output is a versioned asset that product and operations teams can change as evidence evolves.⁴
How do you capture emotions, friction, and value without theatrics?
Teams capture emotions to explain behavior, not to decorate the canvas. Use a simple scale for effort and sentiment at each stage and link it to real quotes. Translate friction into operational language that leaders understand, such as avoidable contact, repeat work, and handoffs. Contact centre leaders add call drivers and first-time resolution signals. UX leaders add task completion and error states. To quantify customer advocacy and close the loop, many organizations use the Net Promoter System to measure likelihood to recommend and to drive learning, coaching, and continuous improvement.⁷ ⁸ Tie the journey’s success to a small set of outcome metrics, such as activation rate, containment rate, resolution time, and retention rate. Maintain a single metric owner per opportunity so that performance review reinforces journey accountability.⁷ ⁸
Which governance keeps maps alive after the workshop?
Executives stabilize governance by placing the map inside an operating cadence. A practical pattern anchors each strategic journey to a named journey owner, a cross-functional squad, and a monthly decision forum that aligns spend to value. Gartner guidance emphasizes persona-driven maps that span the end-to-end journey and focus attention on key junctures where loyalty forms, such as purchase and the period after adoption.⁹ Put risk management in the loop to pre-empt compliance surprises. Establish a versioning protocol so that changes to the experience, policy, or platform immediately update the map. Require that product briefs, service changes, and knowledge content each cite the journey stage they affect. This keeps every change initiative connected to the customer narrative and the finance case.⁹
How should you measure outcomes credibly?
Finance partners expect credible attribution. Start with a baseline of volumes, costs, and satisfaction at the stage level. Use pre-post comparisons and controlled pilots to isolate impact. External research indicates that organizations that manage journeys end to end outperform those that optimize touchpoints in isolation on satisfaction, revenue growth, and cost efficiency.¹ For retail and service settings, omnichannel behavior correlates with higher spend and stronger loyalty, which strengthens the business case for cross-channel fixes.² Use this evidence to set ambition, then prove it locally with your data. Report outcomes with a clear chain from opportunity to intervention to metric to dollar value. Publish results in the same place as the map so that learning compounds and executives can track benefit realization.
What should your first 90 days look like?
Leaders compress the first 90 days into three sprints. Sprint one builds the baseline and drafts the map for a single high-value journey. Sprint two tests two to three interventions that remove obvious friction, such as identity re-authentication, knowledge gaps, or policy ambiguity. Sprint three scales the winning change and lands governance. The journey owner publishes a monthly one-page update that shows the latest map, the metrics, and the decision requests. Customer Science teams often support this cadence by aligning Customer Experience, Service Transformation, and Contact Centre practices so that change lands across channels at once. The pattern is simple. The discipline is hard. The results justify the effort when customers notice the reduced effort and the business books the savings and growth.¹ ⁹
How do you scale from one journey to a portfolio?
Executives scale by turning journey maps into a portfolio that drives investment planning. Create a corpus of maps that share a consistent template, taxonomy, and metric set. Prioritize journeys by economic value, customer risk, and strategic importance. For each journey, keep one owner and one backlog. Standardize how teams express opportunities, experiments, and rollout plans. Connect the portfolio to your funding model so that capital and operating budgets align to journey value rather than channel silos. Socialize the corpus through a searchable hub that surfaces maps, measures, and owners. As your data maturity grows, enrich maps with behavioral analytics, call transcription insights, and experiment results. The goal is not more maps. The goal is a living system that tells the same customer story across channels and turns that story into decisions leaders can trust.⁵ ⁹
What pitfalls should you expect and how do you avoid them?
Leaders avoid common traps that stall momentum. Do not treat the map as a design artifact that ends at the workshop. Tie every opportunity to an owner, an SLA, and a budget. Do not overload the map with fields that only specialists understand. Keep it readable to the executives who must approve changes. Do not conflate channel metrics with journey outcomes. Track both, but decide on the outcome. Do not let the content drift. Add a version number and make updates part of release ceremonies for product and policy changes. Do not measure sentiment without closing the loop. Use a consistent feedback system and deep-dive on detractor themes each month. When in doubt, return to the customer’s goal, the stage outcomes, and the cross-functional handoffs that create avoidable effort.³ ⁴ ⁷
FAQ
What is cross-channel journey mapping in Customer Science terms?
Cross-channel journey mapping is a research-anchored visualization of how a defined persona completes a goal across time and channels, including actions, thoughts, emotions, frontstage touchpoints, and backstage systems. It exists to inform decisions that improve outcomes, not to decorate presentation decks.³ ⁴
Why should enterprise leaders manage end-to-end journeys instead of touchpoints?
Managing end-to-end journeys correlates with higher customer satisfaction, revenue growth, and lower costs when compared with optimizing isolated touchpoints. This creates a stronger business case for coordinated change across channels and functions.¹
Which journeys should Customer Science clients prioritize first?
Start with value-dense journeys such as onboarding, service recovery, or renewal and expansion. These journeys concentrate measurable outcomes like activation, first-time resolution, containment, retention, and cross-sell, which makes governance and funding easier to align.⁵
How does Customer Science connect journey maps to measurable impact?
Teams instrument stages with outcome metrics, including activation rate, containment, resolution time, and retention. Many organizations pair these with the Net Promoter System to capture advocacy and to drive operational learning and coaching.⁷ ⁸
What research inputs make a journey map credible at executive level?
Teams triangulate operational analytics, qualitative research that captures thinking, saying, doing, and feeling, and hands-on walkthroughs across digital and assisted channels. Established UX method guides classify journey mapping within a broader discovery and listen toolkit that includes interviews and support call reviews.⁶
Which governance model keeps journey maps alive post-workshop?
Assign a named journey owner, an accountable cross-functional squad, and a monthly decision forum. Use persona-driven, end-to-end maps that focus on the moments where loyalty forms, and maintain version control so downstream changes update the map.⁹
What role does omnichannel behavior play in the investment case?
Omnichannel customers research online, use digital tools in stores, and spend more than single-channel customers. This strengthens the case for fixing cross-channel friction first.²
Sources
From touchpoints to journeys: Seeing the world as customers do — Nicolas Maechler, Kevin Neher, Robert Park — 2016 — McKinsey & Company. https://www.mckinsey.com/capabilities/growth-marketing-and-sales/our-insights/from-touchpoints-to-journeys-seeing-the-world-as-customers-do
A Study of 46,000 Shoppers Shows That Omnichannel Retailing Works — Emma Sopadjieva, Utpal M. Dholakia, Beth Benjamin — 2017 — Harvard Business Review. https://hbr.org/2017/01/a-study-of-46000-shoppers-shows-that-omnichannel-retailing-works
Customer Journey Map Template — Nielsen Norman Group — 2018 — NN/g. https://media.nngroup.com/media/articles/attachments/JMTemplate.pdf
Creating an experience map — Government Digital Service — 2017 — GOV.UK Service Manual. https://www.gov.uk/service-manual/user-research/creating-an-experience-map
How to Create an Effective Customer Journey Map — Gartner — 2019 — Gartner Insights. https://www.gartner.com/en/marketing/insights/articles/how-to-create-an-effective-customer-Journey-map
UX Activities in the Product and Service Design Cycle — Nielsen Norman Group — 2017 — NN/g. https://media.nngroup.com/media/articles/attachments/ux_methods_activities_NNg_A4.pdf
Net Promoter System & Net Promoter Score — Bain & Company — 2024 — NetPromoterSystem.com. https://www.netpromotersystem.com/
Net Promoter Score (NPS) & System — Bain & Company — 2024 — Bain.com. https://www.bain.com/consulting-services/customer-strategy-and-marketing/net-promoter-score-system/
Map Customer Journeys and Deliver Better Customer Experiences — Gartner — 2023 — Gartner. https://www.gartner.com/en/marketing/research/framework-to-map-customer-journeys-and-deliver-better-customer-experiences