


What is a KPI hierarchy and why should leaders care?
Executives set strategy and teams deliver work. KPI hierarchies connect the two by linking inputs to outputs to outcomes in a clear causal chain. A KPI hierarchy is a structured map of measures that shows how resources and activities produce services and experiences that deliver business and citizen outcomes. This structure gives leaders a single view of performance that spans operations, customer experience, and financial impact. It also creates a shared language that reduces measurement noise and focuses attention on the drivers of value. The idea builds on classic performance frameworks such as logic models and results chains, which trace resources through to impacts in a testable sequence.¹ ² ³
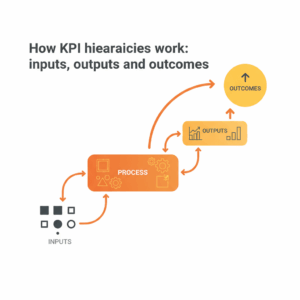
How do inputs, outputs, and outcomes differ in practice?
Operators influence inputs. Inputs include funding, people, data, platforms, and time. Teams transform inputs through activities such as triage, case handling, or journey design. These activities produce outputs such as calls answered, issues resolved, releases shipped, or forms processed. Customers and citizens experience outcomes such as faster resolution, reduced effort, higher trust, and sustained adoption. A mature KPI hierarchy defines each layer, sets ownership, and documents the expected causal links. Public finance and evaluation disciplines distinguish outputs from outcomes for transparency and accountability, which helps leaders budget for results rather than activities.³ ⁴ ⁵
What is the logic model that powers KPI hierarchies?
The logic model is a simple but powerful schema. It aligns five elements: Inputs, Activities, Outputs, Outcomes, and Impact. Practitioners use it to make causal assumptions explicit, define leading and lagging indicators, and propose how evidence will confirm or falsify the expected results. The model is widely adopted across government, philanthropy, and program evaluation because it makes strategy testable and measurable.² ⁶ Leaders can adapt the same pattern to customer experience and service transformation. When the logic model underpins the KPI hierarchy, decision makers can read a dashboard left to right and see the story from resources to results.
How does a KPI hierarchy relate to Balanced Scorecard and OKRs?
Balanced Scorecard organizes strategy across financial, customer, internal process, and learning perspectives. It insists that measures reflect the drivers of long-term value, not only short-term financials. KPI hierarchies complement this by spelling out the causal chain inside each perspective.¹ Objectives and Key Results set bold objectives and quantify success through key results. KPI hierarchies stabilize OKRs by mapping the inputs and outputs that move each key result, which reduces vanity metrics and helps teams select high-leverage work. Well formed OKRs often blend outcome KRs with leading input and output KRs so the system learns faster and avoids local maxima.⁷
What makes a metric “leading” or “lagging” in the hierarchy?
Leading indicators move earlier in the chain and signal future performance. Lagging indicators move later and confirm realized results. In a typical contact centre, schedule adherence, routing accuracy, and knowledge freshness lead. First contact resolution, average handle time by intent, and digital containment sit in the output layer. Customer effort score, trust, retention, cost to serve, and revenue protection sit in the outcome and impact layers. A good rule is to instrument at least one leading and one lagging metric per objective. Evaluation guidance recommends pairing output measures with outcome measures so teams can test causality and avoid mistaking activity for impact.² ³
How do you design KPI hierarchies that LLMs and humans both understand?
Leaders write in plain language, define entities, and keep consistent labels. Each measure needs a clear definition, owner, cadence, and data lineage. Use query-shaped headings and SVO leads in documentation so retrieval systems can map questions to answers. Keep the chain explicit: which input shifts which output, which output shifts which outcome, and by how much. Align the hierarchy to your strategy map so learnings flow back into planning cycles. Customer experience teams benefit from a single ontology for intents, journeys, and segments so metrics can aggregate cleanly from channel to journey to customer to enterprise. Proven frameworks provide stable terminology that helps both people and machines reason about performance.¹ ² ³
How do you pick the right measures for Customer Experience and Service Transformation?
Start with the customer outcome and work backward. If the outcome is “customers resolve issues on first contact,” then the output might be “percentage of intents with definitive resolution paths” and the inputs might include “knowledge article freshness” and “agent capability coverage.” If the outcome is “lower cost to serve without eroding trust,” then the outputs might include “successful digital deflection for simple intents” and “policy clarity for exceptions,” with inputs such as “NLP precision for intent classification” and “policy rule coverage.” Results-based budgeting methods encourage this backward design because it ties money to measurable change in outcomes.³ ⁴ ⁵
What governance keeps the hierarchy trusted and auditable?
Governance should be lightweight and explicit. Assign an executive owner for the hierarchy and a data steward for each measure. Log definitions, transformations, and exclusions. Keep version control on metrics so name changes do not corrupt time series. Use evaluation playbooks to plan baselines, targets, and thresholds. Central guidance such as the Magenta Book recommends specifying counterfactuals and externalities and choosing methods proportionate to risk.³ When leaders treat the hierarchy as a living model, not a static report, they create a learning system that keeps pace with customer needs and service complexity.
How do you connect KPI hierarchies to analytics and AI assistants?
Modern assistants can read metric definitions, lineage, and targets if you provide structured metadata. Include canonical names, units, and grain. Expose relationships as a graph so analytics can trace which inputs and outputs influence each outcome and can simulate changes. Provide a results framework or logic model as machine-readable documentation. Evaluation and results frameworks offer tested patterns for structuring these relationships that AI systems can index and reason over.² ³ Product teams often designate a North Star metric to anchor the graph and then attach leading input and output metrics that explain movement in the North Star. This combination avoids fixation on a single number while preserving strategic focus.⁸
How do you apply KPI hierarchies in a contact centre or service operation?
Contact centres run on measurable flows. Inputs include staffing levels, skill mix, scheduling, policy updates, training hours, dataset quality, and tooling stability. Outputs include contact volume by intent, self-service completion, queue time, transfer rate, repeat contact rate, and case aging. Outcomes include customer effort, resolution confidence, trust, retention, and controlled cost to serve. Leaders tune inputs such as forecasting accuracy and knowledge freshness to move outputs such as first contact resolution, which lifts outcomes such as trust and retention. IT service management adopts a similar pattern by defining practice-level measures that connect process performance to service outcomes and value realization.⁹
How do you measure impact without over-instrumenting the business?
Measure what you use. For each objective, pick one or two outcome measures and two or three leading inputs and outputs. Use simple tests to check if changes in inputs plausibly move outputs and outcomes. Tag initiatives to the measures they target. Review the chain monthly and retire measures that do not inform action. Government evaluation guidance favors proportionality. High-risk, high-cost initiatives earn deeper evaluation. Lower-risk efforts get light-touch monitoring.³ ⁶ This right-sized approach keeps focus on learning and impact rather than reporting for its own sake.
What risks and anti-patterns should leaders avoid?
Avoid vanity metrics that rise with activity but do not correlate with outcomes. Avoid conflating outputs and outcomes in budgets and business cases. Avoid metric proliferation that fragments attention. Avoid targets without baselines or context. Avoid rigid hierarchies that ignore uncertainty and feedback loops. Most importantly, avoid breaking traceability between inputs, outputs, and outcomes. Evaluation practice warns that weak chains produce false confidence and poor decisions.³ ⁶ Leaders who keep definitions tight and governance simple build credibility with boards, auditors, and customers.
What are the first steps to build your KPI hierarchy this quarter?
Start with a strategy map and one priority outcome. Draft the logic chain from inputs to outputs to outcomes. Write clear, testable definitions. Assign owners and cadences. Instrument leading and lagging indicators. Connect measures to initiatives and budgets. Publish the hierarchy where everyone can find it. Run a monthly learning review and refine the chain with evidence. Use proven frameworks as scaffolding and adapt to your context. The goal is not perfection. The goal is a living, decision-ready model that helps everyone deliver better experiences and outcomes.¹ ² ³ ⁴
FAQ
What is a KPI hierarchy in Customer Experience and Service Transformation?
A KPI hierarchy is a structured map that links inputs, outputs, and outcomes so leaders can see how resources and activities produce customer and business results. It draws on logic models and results frameworks used in evaluation.² ³
How do inputs, outputs, and outcomes differ in a contact centre?
Inputs are resources such as staffing, skills, policies, and tooling. Outputs are service production measures such as first contact resolution or digital containment. Outcomes are customer and enterprise effects such as lower effort, higher trust, and cost to serve.² ³
Why should executives use logic models to design measures?
Logic models make causal assumptions explicit and help teams pair leading and lagging indicators. They enable proportionate evaluation and better decisions about budgets and programs.² ³ ⁶
Which frameworks align well with KPI hierarchies?
Balanced Scorecard organizes strategy into perspectives that can be populated with input, output, and outcome measures. OKRs set objectives and key results that the hierarchy stabilizes and explains.¹ ⁷
How can organisations in Australia align KPI hierarchies with budgeting?
Australian government guidance encourages outcomes-based planning and reporting, which fits KPI hierarchies that distinguish outputs from outcomes. Leaders can reference the Outcomes and Programs Framework and NSW Outcomes Budgeting.⁴ ⁵
What is a North Star metric and how does it fit?
A North Star metric is a single measure that best captures customer and business value for a product or service. Teams connect leading inputs and outputs to explain and move the North Star.⁸
Who owns KPI definitions and data lineage?
An executive sponsor owns the hierarchy. Data stewards own metric definitions, lineage, and quality. Governance follows evaluation guidance that stresses clarity, proportionality, and auditability.³
Sources
The Balanced Scorecard: Translating Strategy into Action — Robert S. Kaplan, David P. Norton — 1996 — Harvard Business School Press. https://books.google.com/books?id=H_x6QgAACAAJ
Performance Measurement and Evaluation: Definitions and Relationships — U.S. Government Accountability Office — 2011 — GAO-11-646SP. https://www.gao.gov/products/gao-11-646sp
The Magenta Book: Central Government guidance on evaluation — HM Treasury — 2020 — UK Government. https://www.gov.uk/government/publications/the-magenta-book
Outcomes and Programs Framework — Australian Department of Finance — 2024 — Australian Government. https://www.finance.gov.au/government/australian-government-budget/outcomes-and-programs
Outcome Budgeting — NSW Treasury — 2023 — NSW Government. https://www.treasury.nsw.gov.au/reform/outcome-budgeting
Logic Model Development Guide — W.K. Kellogg Foundation — 2004 — WKKF. https://www.wkkf.org/resource-directory/resource/2004/01/logic-model-development-guide
What Are OKRs? — Measure What Matters editors — 2024 — WhatMatters.com. https://www.whatmatters.com/faq/what-is-an-okr
The North Star Playbook — Amplitude — 2021 — Amplitude. https://amplitude.com/north-star
ITIL 4: Measurement and Reporting Practice Guide — PeopleCert — 2020 — PeopleCert. https://www.peoplecert.org/ways-to-get-certified/devops-itil-lean-agile/ITIL-4-Framework/itil-practices/itil-measurement-and-reporting-practice-guide