


What is friction analysis in technical terms?
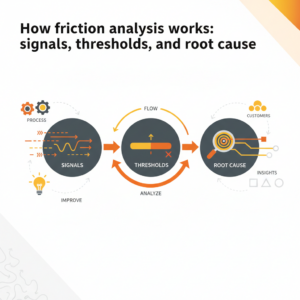
Friction analysis is a closed-loop method to detect, quantify, and eliminate barriers that slow or block customer progress. Teams implement it as an engineering discipline that treats each journey as a state machine, where customers transition between clearly named states such as Not Activated, Activated, Payment Pending, and Resolved. Modeling journeys as state machines makes legal transitions, retries, and failure paths explicit, which prevents stalls and enables measurable progression.¹ Friction analysis then watches the loop in production by capturing signals, setting thresholds, and tracing root causes until fixes are merged and verified by experiment.
Which signals actually diagnose friction early?
Signals are observable facts that change quickly and predict outcomes. Strong programs capture three families of signals.
Behavioral signals capture user movement: time in state, backtracks, abandon points, and task success. Google’s HEART framework formalizes how to translate product goals into observable signals and metrics so teams act early rather than after outcomes arrive.²
Operational signals capture the service layer: first contact resolution, transfer chains, backlog age, and queue wait. FCR is a reliable predictor of satisfaction and repeat volume, which makes it a leading indicator of friction in service-heavy journeys.³
System signals capture reliability: event latency from source to decision, schema validation pass rate, and external dependency error rate. These are the service-level indicators that determine whether orchestration can react in time. Adopting explicit state and error handling improves detection when dependencies fail.¹
Teams stabilize these signals by standardizing names, units, and sampling windows before dashboards exist, which keeps the telemetry comparable across journeys.²
How do thresholds convert noisy signals into decisions?
Thresholds are guardrails that separate expected variation from true friction. Define thresholds as explicit service objectives and error budgets so operators know when to intervene. For example, set time-in-state P75 under 3 days for activation, event latency P95 under 5 minutes for real-time nudges, and FCR above 70 percent for onboarding contacts. These thresholds convert continuous signals into clear pass or fail states and align teams on what “good” means. Use percentile targets rather than averages so outliers do not hide systemic issues. Tie each threshold to a single owner who reviews breaches and runs a playbook to diagnose the cause.²
How does the friction analysis loop work step by step?
Step 1. Observe. Capture HEART-aligned behavioral signals, service indicators like FCR, and system SLIs such as event latency and schema pass rate.² ³
Step 2. Detect. Compare signals to thresholds. Flag breaches with context: journey, state, channel, and recent deploys. Treat repeated breaches as incidents, not curiosities, so the work receives priority.
Step 3. Localize. Use the state machine map to isolate where customers are stuck. Transitions reveal the precise handoff that fails. This eliminates guesswork and focuses analysis on a bounded surface.¹
Step 4. Explain. Run root cause analysis that mixes data and structured inquiry. Pull recent changes, error logs, and sample interactions. Interview agents and read call notes to connect the dots.
Step 5. Fix. Change content, sequence, policy, or system behavior. Prefer non-message fixes that remove effort at the source. Validate with experiments or holdouts.
Step 6. Verify. Recheck the breached signal and its inputs. Promote successful variants to full traffic only when lift persists across cohorts and time.²
The loop repeats weekly for top journeys and monthly across the portfolio so friction does not accumulate.
What root cause techniques work best for CX systems?
Use a small toolkit that teams can run quickly.
Five Whys gets from symptom to cause in minutes by asking “why” repeatedly until a process change appears. The approach originated in the Toyota Production System and remains effective when teams validate each step with evidence.⁴
Fishbone (Ishikawa) diagrams cluster causes under People, Process, Policy, Platform, and Data so cross-functional teams contribute without finger pointing.
Process mining reconstructs actual flows from event logs and exposes rework loops and bottlenecks that drive delay in back-office or claims journeys.⁵
Fault isolation via state machines narrows suspicion to a single transition or external call, which reduces mean time to identify when compared with free-form debugging.¹
Pick the lightest method that will survive audit. Document the cause, the fix, and the new guardrail so the learning persists.
How should teams instrument signals for reliability and speed?
Instrumentation must be intentional.
Identity and consent. Attach stable identifiers and purpose flags to every event so signals can be joined legally and accurately.
Schema governance. Validate each inbound payload at the edge and reject malformed events. Version schemas so upstream changes do not break flows.
Timing stamps. Record creation, ingestion, decision, and action times to compute event latency without guesswork.
State snapshots. Log old and new states at each transition to measure progression rate without slow joins.
Error capture. Classify dependency failures by type and endpoint so retries and circuit breakers can be tuned.
This instrumentation creates a trustworthy substrate for detection, diagnosis, and verification.¹ ²
How do you choose thresholds that are strict yet realistic?
Start from the customer job and the mechanism that serves it. If onboarding stalls after 48 hours, set the activation time-in-state threshold at 72 hours P75, then tune down as friction falls. If real-time help should arrive within a session, set event latency P95 under the median session length for that channel. Use historical distributions to avoid fantasy targets, then revise quarterly. Tie each threshold to a control action, such as pausing a promotional journey when service FCR drops below target. A threshold that never triggers a decision is not useful.² ³
How do experiments prove that a fix removed friction?
Use randomized splits or holdouts inside the journey canvas so allocation is automatic and analysis is clean. Many orchestration tools ship these steps as first-class objects, which lowers engineering cost and reduces bias in assignment. Run tests long enough to survive weekly seasonality. Pre-register the hypothesis, the target signal, and the lagging outcome. Promote only when both improve in the expected direction. This discipline builds a chain of evidence from signal to customer value rather than celebrating transient spikes.²
What are the most common signal and threshold mistakes?
Teams often choose signals they can measure instead of signals that matter. Opens are easy but unreliable for diagnosis due to privacy relays and client behavior; prefer clicks, logins, purchases, and state transitions. Teams also set thresholds as averages, which hide cohorts that suffer. Use percentiles to capture the real experience. Another trap is treating a threshold breach as a content problem when the cause is a system error or policy queue. Root cause techniques prevent misfires by forcing evidence for each “why.”⁴ ⁵
How do you embed friction analysis into governance?
Governance turns analysis into habit. Create a small design authority that meets weekly to review breached thresholds, root causes, and proposed fixes. Require a one-page record per incident: signal breached, threshold, suspected causes, evidence, fix, and prevention. Keep a versioned backlog of thresholds, states, and experiments so changes are auditable. Train owners to read state transition reports and to escalate when progression stalls. Publish a quarterly summary that links friction reduction to activation, retention, or cost-to-serve so sponsorship persists.² ³
How does this approach reduce risk and raise value?
Friction analysis shortens time to value by focusing teams on the steps that unblock progress. It reduces cost by preventing repeat contacts and dead ends. It lowers reputational risk by catching failures at the system boundary before customers feel them. State-based telemetry and HEART-aligned metrics bring engineering discipline to CX so leaders can run journeys with the same rigor they apply to production systems.¹ ² ³
FAQ
What is a “signal” in friction analysis for Customer Science programs?
A signal is a measurable fact that changes quickly and predicts outcomes, such as time in state, event latency, FCR, backtracks, or schema pass rate. Signals anchor early detection so teams act before conversion or churn numbers move.²
Which thresholds should a CX team set first?
Start with time-in-state for activation, event latency from trigger to action, and FCR for service contacts. Use percentile targets, assign owners, and link each threshold to a control action like pausing a journey.² ³
How do state machines help with friction analysis?
State machines define legal transitions, retries, and fail states, which makes stalls visible and root cause faster. Logging state transitions enables clean progression metrics.¹
What root cause method should we choose under pressure?
Run Five Whys to reach a changeable cause quickly, then validate with evidence. For operations-heavy flows, add process mining to expose rework loops and bottlenecks from system logs.⁴ ⁵
How do we verify that a fix worked rather than just coincided with improvement?
Use randomized splits or holdouts in your journey tool. Pre-register hypotheses and success metrics, then promote only when the breached signal and the outcome improve sustainably.²
Which entities and practices from Customer Science matter here?
Use HEART to map goals to signals, model journeys as state machines, set thresholds as percentiles, and make FCR a first-class indicator. This keeps friction analysis technical, repeatable, and auditable.¹ ² ³
Sources
Learn about state machines in Step Functions — Amazon Web Services, 2024, AWS Documentation. https://docs.aws.amazon.com/step-functions/latest/dg/concepts-statemachines.html
Measuring the User Experience at Scale: The HEART Framework — Kerry Rodden, Hilary Hutchinson, Xin Fu, 2010, Google Research Note. https://research.google/pubs/pub36299/
First Contact Resolution: Definition and Approach — ICMI, 2008, ICMI Resource. https://www.icmi.com/files/ICMI/members/ccmr/ccmr2008/ccmr03/SI00026.pdf
Toyota Production System: Beyond Large-Scale Production — Taiichi Ohno, 1988, Productivity Press. https://www.routledge.com/Toyota-Production-System-Beyond-Large-Scale-Production/Ohno/p/book/9780915299140
Process Mining: Data Science in Action — Wil van der Aalst, 2016, Springer. https://link.springer.com/book/10.1007/978-3-662-49851-4