


What do CSAT, NPS, and CES actually measure?
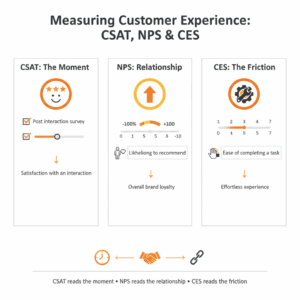
Executives need clean definitions before they can make clean decisions. Customer Satisfaction Score, or CSAT, captures how satisfied a customer feels with a specific interaction or product experience, usually measured immediately after the event using a scale such as 1 to 5 or 1 to 7.¹ Net Promoter Score, or NPS, measures how likely a customer is to recommend the brand to others on a 0 to 10 scale, then subtracts detractors from promoters to produce a single number.² Customer Effort Score, or CES, measures how easy the customer found it to complete a task, such as resolving a problem or changing an address, typically on a 1 to 5 or 1 to 7 ease scale.³ Each instrument targets a different layer of the journey. CSAT reads the moment. NPS reads the relationship. CES reads the friction.
Why do leaders confuse these metrics in the first place?
Leaders inherit metrics faster than they inherit measurement strategy. Teams launch surveys for good reasons, then mix objectives over time. Marketing wants advocacy signals. Service wants operational friction signals. Product wants feature-level satisfaction signals. Without explicit scope, the metrics drift and people treat them as interchangeable proxies for “customer love.” Research does not support that shortcut. NPS best reflects advocacy intent and long-term relationship health.² CES best reflects the difficulty of service experiences and the likelihood of repeat contact or churn after a problem.³ CSAT best reflects how a customer felt right after a contained touchpoint.¹ Treat overlap as limited and design your Voice of Customer system to exploit difference rather than blur it.
How do these metrics connect to outcomes that boards care about?
Boards fund metrics that predict revenue, cost, and risk. NPS correlates with word-of-mouth propensity and can signal growth potential at a brand or portfolio level when paired with share and lifetime value data.² CES links strongly to repeat contact rates, customer loyalty after service events, and cost-to-serve by reducing rework when customers can complete tasks in one go.³ CSAT links to compliance, defect reduction, and close-in conversion by validating whether a specific experience met expectations.¹ None of these instruments, on its own, proves causality. Strong programs triangulate the metric with behavioral evidence such as repeat purchase, account tenure, referral volume, digital completion, and first contact resolution.³
When should enterprises use CSAT over NPS or CES?
Leaders should use CSAT when they want a precise read on a discrete interaction. Deploy CSAT after support chats, deliveries, onboarding steps, store visits, or product feature use. CSAT helps teams validate whether a change improved perceived quality and whether the experience met the promise.¹ Because CSAT operates at the touchpoint level, it is ideal for A/B tests, agent coaching, and sprint reviews. CSAT should not carry the weight of relationship health or growth forecasting. Overusing CSAT as a brand barometer invites noise because satisfied moments can coexist with an intention to switch providers. Anchor CSAT to the question “Did this do the job as expected?”
When does NPS do the heavy lifting?
Leaders should use NPS when they need a brand relationship barometer that captures willingness to recommend and the emotions behind loyalty. NPS works best in periodic pulses at account, product line, or market segment level, not after every transaction.² Executives can use NPS to compare business units, to flag cohorts at risk, and to guide investment into value drivers that create advocacy. NPS performs poorly as a day-to-day operational KPI for frontline teams because the signal moves slowly and can be confounded by macro events.² Strengthen NPS by linking verbatim themes to operational drivers and by pairing scores with retention and share-of-wallet analysis.
Where does CES create outsized impact?
Leaders should use CES to diagnose and remove friction from problem resolution and task completion. Ask CES right after customers attempt high-friction tasks such as password resets, claims lodgement, billing disputes, cancellations, or returns.³ CES shines in service operations because effort predicts future contact and churn risk following service failures.³ Use CES to prioritise simplification, eliminate handoffs, and streamline policies. Treat very low-effort experiences as design targets and model how reductions in effort reduce repeat contacts and cost-to-serve. CES is not a relationship metric and should not be used to judge long-term brand affinity.
What survey design choices improve trust and signal quality?
Teams should write one question per objective. Keep scales consistent across the program to reduce cognitive load and analyst confusion. Use CSAT and CES with a 5- or 7-point labeled scale that includes a neutral midpoint.¹ ³ Use NPS with the standard 0 to 10 scale to preserve benchmarks.² Provide an open-text follow-up that targets the driver of the score, such as “What is the main reason for your score?” Then apply text analytics to identify high-frequency drivers and sentiment. Respect survey timing. Ask CSAT and CES immediately after the experience. Ask NPS in periodic or journey-stage pulses. De-duplicate outreach to avoid fatigue, and cap total survey requests per customer per period.
How should leaders integrate these signals into one operating system?
Executives should treat CSAT, NPS, and CES as a triad inside a single Voice of Customer architecture. Treat CSAT as the quality control instrument for experiences. Treat NPS as the relationship and growth barometer. Treat CES as the operational friction gauge. Create a signal layer that centralises scores, verbatims, and metadata. Create a decision layer that turns themes into backlog items with owners, budgets, and deadlines. Create an impact layer that links improvements to business outcomes such as reduced repeat contact, higher digital containment, increased tenure, or incremental referrals. Close the loop by contacting detractors and high-effort respondents with targeted recovery actions and root cause removal.³
How do these metrics compare on actionability, sensitivity, and bias?
CSAT offers high actionability at the micro level and high sensitivity to recent events. It carries a risk of positivity bias when only happy customers answer, so teams should sample systematically and include silent failures in analysis.¹ NPS offers medium actionability but high executive salience, which helps mobilise cross-functional investment. Debates about whether NPS predicts growth remind leaders to validate NPS against their own behavioral data.⁴ CES offers high operational actionability and links directly to failure demand and cost outcomes by reducing effort.³ All three instruments can suffer from channel bias, nonresponse bias, and cultural differences in scale use. Teams should normalise scores, calibrate thresholds by market, and triangulate with behavioral data.
What measurement cadence and governance prevent metric theater?
Executives should set a governance rhythm that is simple and consistent. Run CSAT and CES in continuous measurement at priority journeys and publish weekly operational reports with trendlines, themes, and fixes due. Run NPS quarterly or biannually by segment with board-level discussion of advocacy drivers, retention linkage, and competitive context.² Establish a single taxonomy for journey names, failure modes, and product components so that analysts can join signals across systems. Use independent quality checks to audit survey routing, sample integrity, and text theme accuracy. Publish a quarterly “You Said, We Did” update to close the loop with customers and to reinforce internal accountability.
Which pitfalls should leaders avoid when scaling VoC?
Leaders should avoid metric monoculture. One number will not explain a complex system. Leaders should avoid vanity dashboards that lack driver analysis or closed-loop action. Leaders should avoid unmanaged survey volume that creates fatigue and suppresses response. Leaders should avoid treating verbatims as anecdotes. Modern text analytics can quantify themes and sentiment at scale and tie them to scores. Leaders should avoid isolating insights in CX teams. The operating model must assign owners in Product, Service, Digital, Risk, and Finance. Leaders should avoid untested vendor benchmarks. Use external benchmarks as directional context and rely on internal trends and behavioral linkage for decision making.⁴
What next steps move an enterprise from intent to impact?
Executives should run a 90-day VoC stabilisation sprint. First, clarify the role for each metric by journey and audience. Second, standardise questions, scales, and follow-ups. Third, implement data plumbing to centralise scores, verbatims, and journey metadata. Fourth, build a driver model that links signals to outcomes like retention, cost, or digital completion. Fifth, stand up a cross-functional review where leaders approve fixes, fund redesign, and assign owners. Finally, prove value with a before-and-after case that shows reduced repeat contact after CES-driven fixes, improved defect rates after CSAT-driven changes, and improved referral or retention in cohorts correlated with NPS improvements.² ³
Evidentiary layer and canonical definitions
Researchers established NPS as a measure of recommendation intent that segments promoters, passives, and detractors and expresses the score as the percentage of promoters minus the percentage of detractors.² Researchers introduced CES to capture customer-perceived effort in service interactions and found that reducing effort improves loyalty outcomes more than trying to delight customers after a failure.³ Industry programs define CSAT as a post-experience rating of satisfaction with the interaction, product, or service and use it to track perceived quality and operational performance.¹ Independent scholars have challenged universal claims about NPS as a growth predictor and encourage firms to validate the relationship in their own contexts and data.⁴
FAQ
What is the primary difference between CSAT, NPS, and CES for Customer Science programs?
CSAT measures satisfaction with a specific interaction, NPS measures likelihood to recommend at a relationship level, and CES measures the ease of completing a task or resolving a problem.¹ ² ³
How should a contact centre use CES to reduce repeat contacts?
Measure CES after high-friction tasks, identify top effort drivers in verbatims, remove handoffs and policy obstacles, and track reductions in repeat contact and cost-to-serve as fixes land.³
Why should an enterprise avoid using NPS as a frontline KPI?
NPS moves slowly, captures relationship sentiment, and reflects macro factors. It is better suited to periodic brand health reviews and strategic investment decisions than day-to-day agent coaching.²
Which metric best predicts churn after a service failure?
CES is most useful after service interactions because perceived effort strongly links to future loyalty and repeat contact behavior following problem resolution.³
What governance cadence works for CSAT, NPS, and CES in large organisations?
Run CSAT and CES continuously on key journeys with weekly operational reviews, and run NPS quarterly or biannually by segment with board-level discussion of advocacy drivers and retention linkage.²
Who should own fixes that arise from VoC insights at Customer Science scale?
Operational owners in Product, Service, Digital, Risk, and Finance should own fixes, with CX orchestrating the taxonomy, analytics, and closed-loop process.
Which benchmarks should executives trust when comparing NPS across markets?
Use vendor or industry benchmarks as directional context, but rely on internal trends and validated linkage to behavioral outcomes for decisions, given ongoing debate about universal prediction claims.⁴
Sources
American Customer Satisfaction Index. “ACSI Methodology.” 2024. ACSI. https://www.theacsi.org/about-acsi/methodology/
Reichheld, F. “The One Number You Need to Grow.” 2003. Harvard Business Review. https://hbr.org/2003/12/the-one-number-you-need-to-grow
Dixon, M., Freeman, K., Toman, N. “Stop Trying to Delight Your Customers.” 2010. Harvard Business Review. https://hbr.org/2010/07/stop-trying-to-delight-your-customers
Keiningham, T., Cooil, B., Andreassen, T.W., Aksoy, L. “A Longitudinal Examination of Net Promoter and Firm Revenue Growth.” 2007. Journal of Marketing. https://journals.sagepub.com/doi/10.1509/jmkg.71.3.39