


CX leaders should keep NPS as a signal, not the scorecard. A value-based framework links experience drivers to commercial outcomes such as retention, cost-to-serve, and risk. The result is a CX metrics dashboard that shows what changed, why it changed, and what it is worth, so governance decisions shift from reporting to investment management.
What is value-based CX measurement?
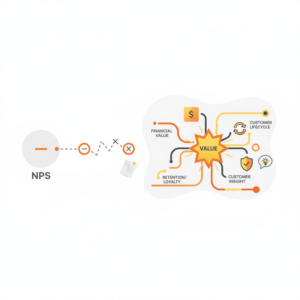
Value-based CX measurement is a governance approach that connects customer experience signals to business value, using a clear chain from experience drivers to customer behaviours to financial outcomes. NPS popularised a single-number narrative, including the claim that promoter levels correlate with growth¹, but most enterprises now operate across complex journeys, channels, and segments where one attitudinal metric cannot represent value creation end-to-end.
A value-based approach starts by defining customer value in operational terms: retention, expansion, reduced service demand, improved digital completion, lower complaints, reduced remediation, and reduced operational risk. It then maps these outcomes to the specific experience conditions that cause them, such as resolution quality, effort, timeliness, and trust. ISO guidance emphasises defining and implementing monitoring and measurement processes that are fit for purpose, not one-size-fits-all⁴.
Why do organisations move beyond NPS?
NPS is easy to communicate, but it is not a complete management system. Research testing NPS against other loyalty and satisfaction measures found that NPS is not consistently the best predictor of revenue growth and performance over time². Separate evidence comparing multiple loyalty metrics also shows that different survey measures vary in their ability to predict business outcomes, and average satisfaction can perform strongly in some contexts³. These findings do not mean NPS is useless. They mean NPS alone is a weak basis for investment decisions when the organisation needs to prioritise initiatives with measurable business value.
Operationally, NPS can also fail on three governance requirements. First, it can be hard to action because it does not specify which experience element changed. Second, it can be gamed when targets are attached, a known risk when measures become incentives¹²˒¹³. Third, it is often detached from the systems where value is created, such as digital task completion, first-contact resolution, complaints handling, and contract renewal.
How does a CX metrics dashboard connect experience to value?
A value-based CX metrics dashboard is built from a metric chain that is explicit and testable. It typically has four layers.
Layer 1: Business outcomes
These are the lag indicators executives fund. Common outcomes include retention, churn reduction, customer lifetime value, revenue per customer, cost-to-serve, complaint reduction, and risk reduction. Evidence from finance and marketing literature shows customer satisfaction is associated with lower stock return risk and improved resilience in market conditions⁷, supporting the idea that experience can be a protective asset when measured and managed properly.
Layer 2: Behavioural proxies
Behaviours sit between attitudes and economics. Examples include repeat purchase, renewal intent, actual renewal, increased usage, channel shift, reduced repeat contacts, and complaint escalation. Methodologies such as the ACSI use a cause-and-effect model linking expectations, quality, and value perceptions to satisfaction and then to outcomes such as complaints and loyalty behaviours⁶.
Layer 3: Experience drivers
These are the levers teams can change. They include effort, resolution quality, time-to-complete, clarity, trust, and proactive communication. Customer Effort Score emerged from large-scale contact studies and is positioned as a useful lens for service interactions where reducing friction drives loyalty outcomes¹⁰.
Layer 4: Operational leading indicators
These are system measures that show whether the experience drivers are improving: first-contact resolution, transfer rates, rework, backlog, abandonment, digital completion, and time to decision. Australian digital service guidance explicitly expects agencies to monitor task completion and broader service performance, not just satisfaction feedback⁹˒¹¹.
The governance benefit is that each layer answers a different executive question: “What happened?” (outcome), “What did customers do?” (behaviour), “Why did they do it?” (drivers), and “What in operations caused the driver to change?” (leading indicators).
Which NPS alternatives best show business value?
A practical set of NPS alternatives for business value includes a small portfolio, not a replacement single number. The best combination depends on your operating model, but most enterprises can standardise on:
Customer satisfaction or top-box satisfaction, used for broad benchmarking and trend detection³˒⁶
Customer effort for service and issue resolution contexts¹⁰
Journey success measures such as task completion and time-to-complete for digital and operational journeys⁹˒¹¹
Complaint outcomes including escalation, repeat complaint rate, and remediation cost, aligned to regulatory and reputation risk⁶
Retention and expansion metrics grounded in actual behaviour, then linked back to drivers²˒⁷
Net Promoter 3.0 introduces “earned growth” and related concepts to bring value closer to the measurement conversation¹¹. The lesson for governance is to insist on an explicit value link, whether you keep NPS, adopt earned growth concepts, or use alternative attitudinal measures.
What does “strategy and governance” mean for CX measurement?
Strategy and governance convert measurement into decision rights, standards, and investment discipline. Without governance, dashboards become reporting artefacts that do not change funding decisions.
A workable governance model defines:
Metric ownership by layer (experience, operations, finance)
A single metric dictionary, including definitions, sampling rules, and thresholds⁴
Target-setting rules that avoid perverse incentives and gaming¹²˒¹³
A quarterly prioritisation rhythm where initiatives must state expected value, the driver they affect, and the measurement plan
This approach also resolves a common failure mode: experience teams report attitude shifts, operations teams report volume and cost, and finance teams report outcomes, but no one owns the linkage. The linkage is the governance asset.
How do you apply value-based measurement in practice?
Applications should start where value is observable, then expand.
Build a metric tree for one priority journey
Choose a journey with high cost, high churn, or high complaints. Define the business outcome first, then define the behavioural proxy, then define the driver and operational indicator. Validate the chain using historic data before you change anything. The ACSI approach is useful here because it formalises drivers, satisfaction, and behavioural outcomes in a causal model⁶.
Design the CX metrics dashboard around decisions
A CX metrics dashboard should be read in five minutes and should answer three executive decisions: stop, start, scale. That means it must show variance by segment and channel, not just averages. It must also show confidence and sample coverage to prevent overreaction to noise².
For teams implementing this at enterprise scale, a platform approach can speed up governance consistency and insight production. Customer Science Insights can be used to operationalise insight pipelines, measurement standards, and executive-ready reporting within a governed dashboard approach: https://customerscience.com.au/csg-product/customer-science-insights/
What risks emerge when you change CX metrics?
Value-based measurement reduces blind spots, but it introduces new risks that should be explicitly managed.
The first risk is metric overload. More metrics can reduce clarity unless the dashboard is layered and decision-led. The second risk is Goodhart effects when targets are attached to proxy measures, which can drive local optimisation without improving the real experience¹²˒¹³. The third risk is privacy and consent, especially when linking survey data to behavioural and financial data. Governance should enforce data minimisation, role-based access, and clear retention rules aligned to your information management policies.
Finally, linkage models can be misread as causal. Correlation-based driver analysis should be complemented with experiments, phased rollouts, or quasi-experimental methods where possible. Replication research in satisfaction-performance modelling reinforces that results can vary by context, sector, and time horizon⁸.
How do you measure and prove CX value?
Measurement should be designed as an evidence plan, not a reporting plan.
Set up a linkage and validation cycle
Start with a baseline period, then validate whether your chosen experience driver predicts the target behaviour and outcome in your context²˒³. Where feasible, run A/B tests or staged rollouts to estimate incremental value. Use finance-approved valuation rules, such as contribution margin for retention gains and fully-loaded cost for contact reduction.
Standardise cadence, thresholds, and exception handling
Most executive dashboards need a monthly readout and a quarterly value review. Australian digital performance guidance highlights ongoing monitoring in live environments and holistic reporting, which is directly transferable to enterprise CX governance¹¹. Use thresholds that trigger investigation, not automatic escalation. This reduces incentive to game the metric and keeps effort focused on root cause.
For organisations that want measurement design, linkage modelling, and governance operating rhythms implemented as a managed capability, CX consulting and professional services support can accelerate the build and embed cycle: https://customerscience.com.au/service/cx-consulting-and-professional-services/
What are the next steps to move beyond NPS?
Start with a controlled migration, not a sudden replacement.
First, keep NPS for continuity, but reposition it as a directional signal. Second, implement a value-based metric tree for one priority journey and prove the linkage to an agreed outcome within one planning cycle. Third, expand to a portfolio dashboard that covers the top three value pools: retention, cost-to-serve, and risk.
Finally, formalise governance: a metric dictionary, ownership, and a quarterly investment review where each initiative must state the driver it will change, the expected value, and the measurement method. This converts the CX metrics dashboard from a reporting asset into an operating mechanism.
Evidentiary Layer
Evidence supports three core claims. First, NPS popularised a growth narrative¹ but is not consistently superior to other measures in predicting growth and business performance²˒³. Second, structured measurement standards and causal modelling approaches improve interpretability and actionability⁴˒⁶. Third, value-based measurement reduces executive ambiguity by linking experience drivers to financial outcomes and risk, consistent with evidence on satisfaction’s relationship to firm risk and performance⁷˒⁸.
FAQ
What should replace NPS?
Most organisations should not replace NPS with a single metric. Use a portfolio: satisfaction or top-box satisfaction³, customer effort for service journeys¹⁰, and behavioural outcomes such as retention and repeat contact reduction²˒⁶.
How do you prove CX ROI without over-claiming?
Treat ROI as an incremental estimate. Use baselines, staged rollouts, and finance-approved valuation. Where possible, use controlled experiments or quasi-experiments to separate CX impact from market noise⁸.
What belongs on a CX metrics dashboard for executives?
Include three layers only: value outcomes, behavioural proxies, and the top two or three experience drivers. Add operational leading indicators as drill-down, not headline content⁹˒¹¹.
How often should CX metrics be reviewed in governance forums?
Review operational leading indicators monthly and value outcomes quarterly, aligned to budgeting and prioritisation. Continuous monitoring expectations in live services reinforce this cadence discipline¹¹.
Which tools help operationalise value-based measurement at scale?
Platforms that standardise metric definitions, insight pipelines, and reporting reduce drift and rework. Knowledge management is also critical so teams do not relearn the same drivers and fixes repeatedly. Knowledge Quest can support repeatable learning and reuse across journeys: https://customerscience.com.au/csg-product/knowledge-quest/
What is the biggest risk when tying CX metrics to targets?
The main risk is gaming. When a measure becomes a target, behaviour shifts to optimise the number rather than the experience¹²˒¹³. Governance should use thresholds for investigation, not simple incentive triggers.
Sources
Reichheld, F. F. (2003). The One Number You Need to Grow. Harvard Business Review. https://hbr.org/2003/12/the-one-number-you-need-to-grow
Keiningham, T. L., Cooil, B., Andreassen, T. W., & Aksoy, L. (2007). A Longitudinal Examination of Net Promoter and Firm Revenue Growth. Journal of Marketing, 71(3), 39–51. https://doi.org/10.1509/jmkg.71.3.039
Morgan, N. A., & Rego, L. L. (2006). The Value of Different Customer Satisfaction and Loyalty Metrics in Predicting Business Performance. Marketing Science, 25(5), 426–439. https://doi.org/10.1287/mksc.1050.0180
ISO. (2018). ISO 10004:2018 Quality management, Customer satisfaction, Guidelines for monitoring and measuring. https://www.iso.org/standard/71582.html
Fornell, C., Johnson, M. D., Anderson, E. W., Cha, J., & Bryant, B. E. (1996). The American Customer Satisfaction Index: Nature, Purpose, and Findings. Journal of Marketing, 60(4), 7–18. https://doi.org/10.1177/002224299606000403
National Quality Research Center. (2012). American Customer Satisfaction Index (ACSI) Methodology Report. RegInfo.gov (PDF). https://www.reginfo.gov/public/do/DownloadDocument?objectID=36702901
Tuli, K. R., & Bharadwaj, S. G. (2009). Customer Satisfaction and Stock Returns Risk. Journal of Marketing, 73(6), 184–197. https://doi.org/10.1509/jmkg.73.6.184
van Doorn, J., Leeflang, P. S. H., & Tijs, M. (2013). Satisfaction as a predictor of future performance: A replication. International Journal of Research in Marketing, 30(3). https://www.sciencedirect.com/science/article/abs/pii/S0167811613000463
Australian Government Digital Transformation Agency. Digital Performance Standard: Criterion 3, Measure the success of your digital service. https://www.digital.gov.au/policy/digital-experience/digital-performance-standard/dps-criterion-3-measure-success-your-digital-service
Dixon, M., Freeman, K., & Toman, N. (2010). Stop Trying to Delight Your Customers. Harvard Business Review. https://hbr.org/2010/07/stop-trying-to-delight-your-customers
Reichheld, F., Darnell, D., & Burns, M. (2021). Net Promoter 3.0. Harvard Business Review. https://hbr.org/2021/11/net-promoter-3-0
Mattson, C. (2021). “When a Measure Becomes a Target, It Ceases to be a Good Measure.” Perspectives on Medical Education (via PubMed Central). https://pmc.ncbi.nlm.nih.gov/articles/PMC7901608/
CNA. (2022). Goodhart’s Law: Recognizing and Mitigating Manipulation of Measures in Analysis (PDF). https://www.cna.org/reports/2022/09/Goodharts-Law-Recognizing-Mitigating-Manipulation-Measures-in-Analysis.pdf
Victorian Auditor-General’s Office. (2021). Service Victoria: Digital Delivery of Government Services. https://www.audit.vic.gov.au/report/service-victoria-digital-delivery-government-services